B.5 Trend line with geom_smooth
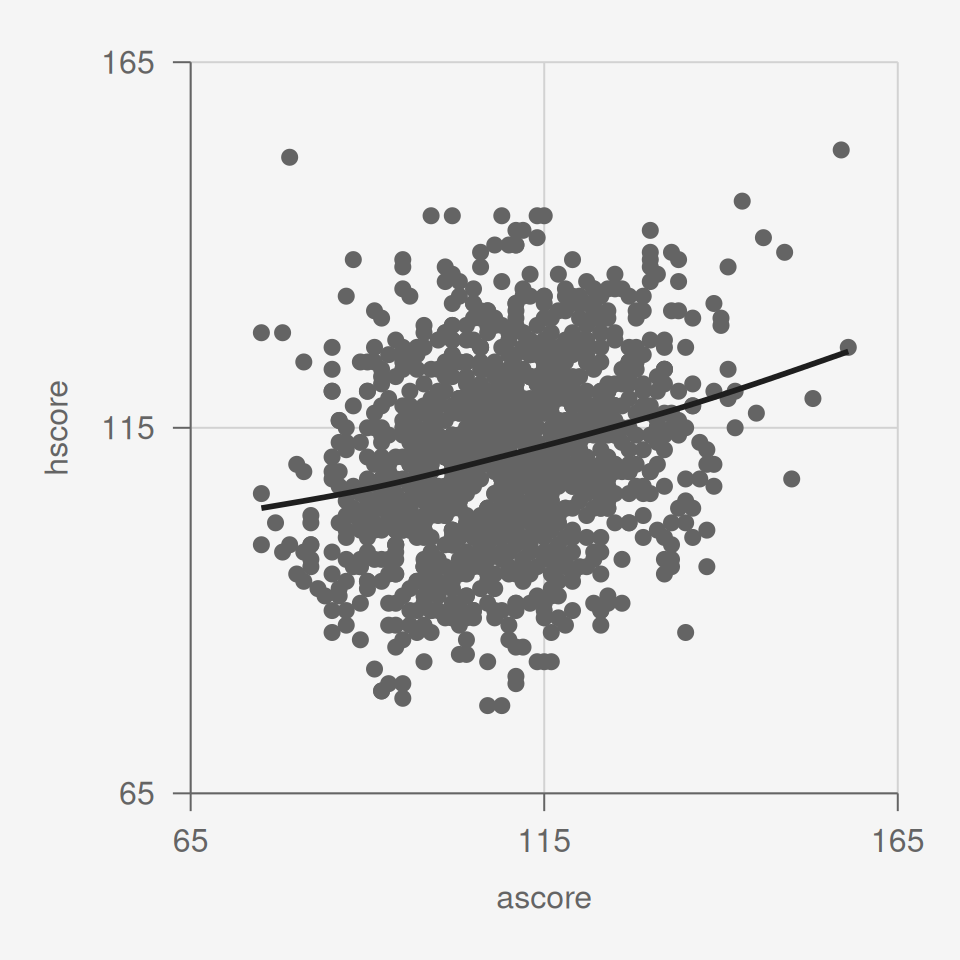
We can add a trendline to our scatter plot using geom_smooth after geom_point.
Code
[1] 57.35768
[1] 80
[1] 20
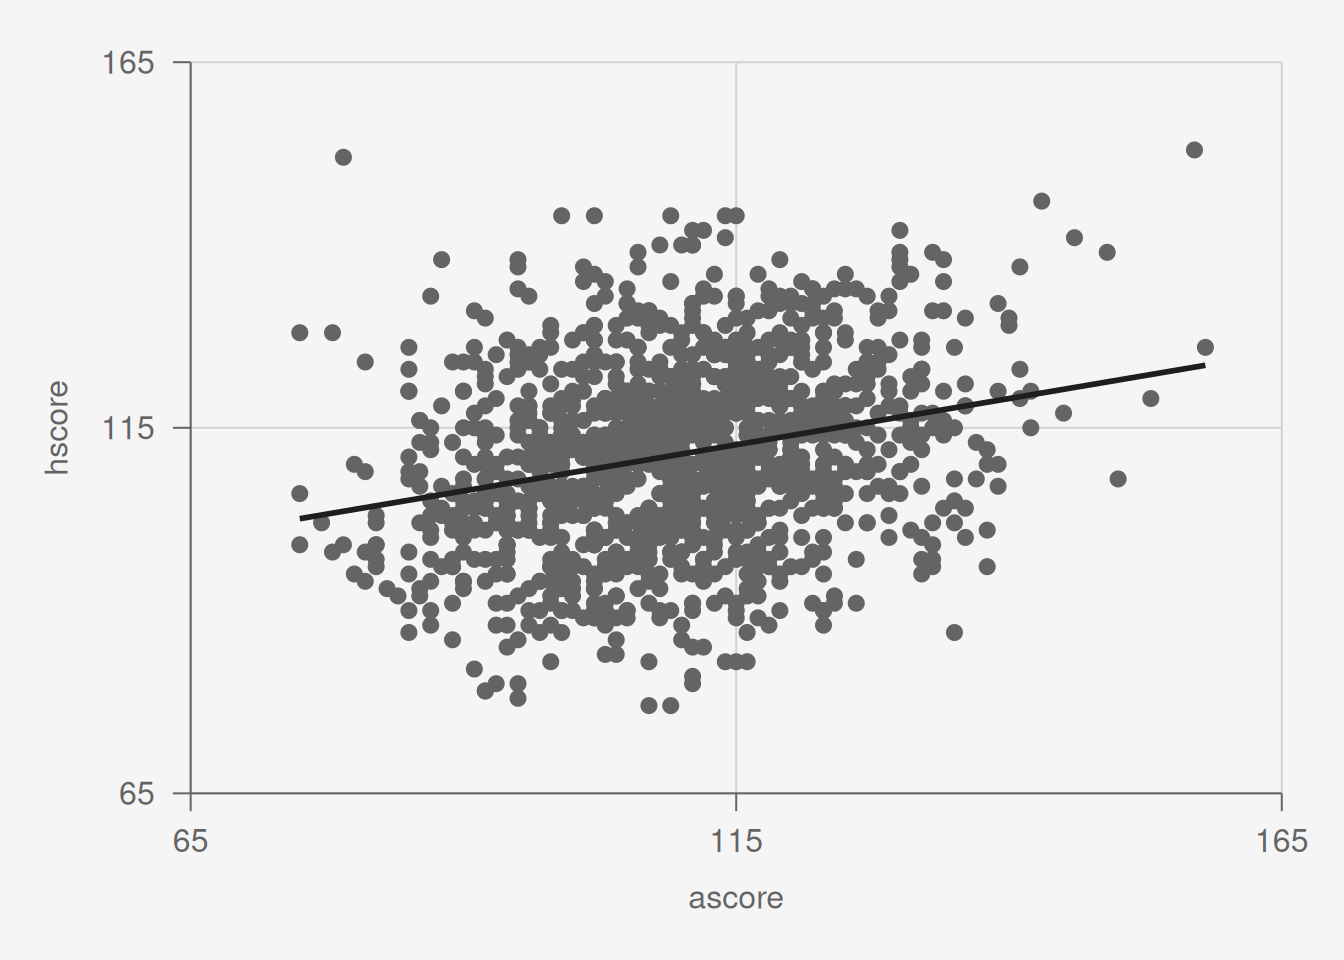
[1] 157.3577By default it will be a smooth curve as opposed to a line. For a line, use method = 'lm' (lm is the function used for linear regression).
Code
[1] 57.35768
[1] 80
[1] 20
[1] 157.3577