gganimate
lmer
=
<-
.
_
pubtheme
tidyverse
DT
tidycensus
ggplot
plot.lm
methods
getAnywhere
browser()
debug
debugonce
foreach
rbind
dplyr
filter
select
str
mutate
arrange
summarise
reframe
bind_rows
group_by
ifelse
pivot_wider
pivot_longer
left_join
geom_point
ggsave
geom_smooth
group
facet_wrap
alpha
geom_jitter
geom_hex
geom_col
fill
position_dodge
geom_text
geom_histogram
geom_line
geom_tile
theme
ggplotly
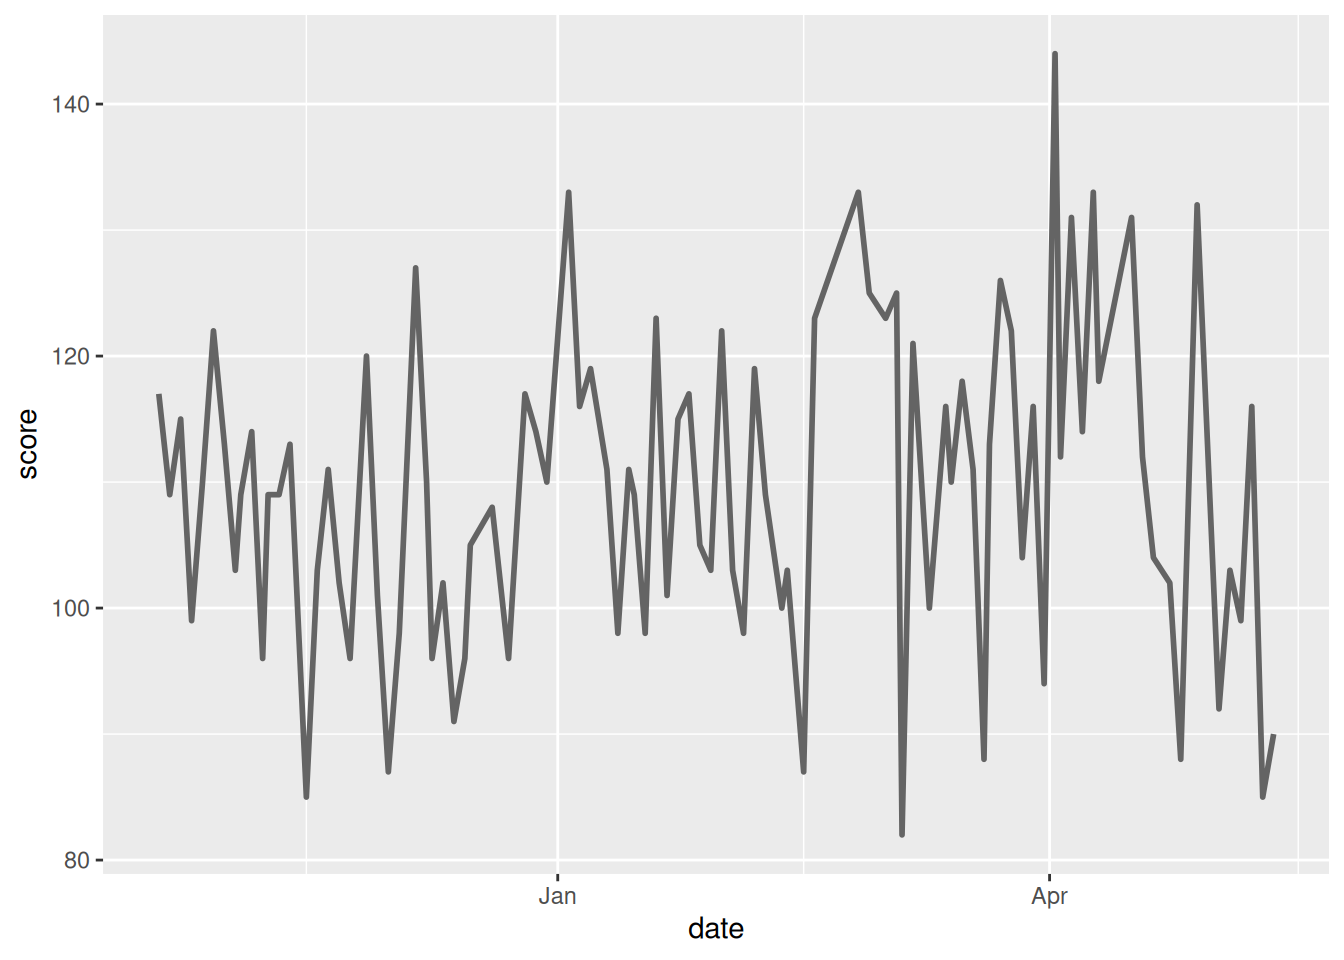
dg = dd %>%
  filter(team == 'PHI')

ggplot(dg, aes(x = date,
               y = score))+
  geom_line()
For multiple line plots, you can color by a column.
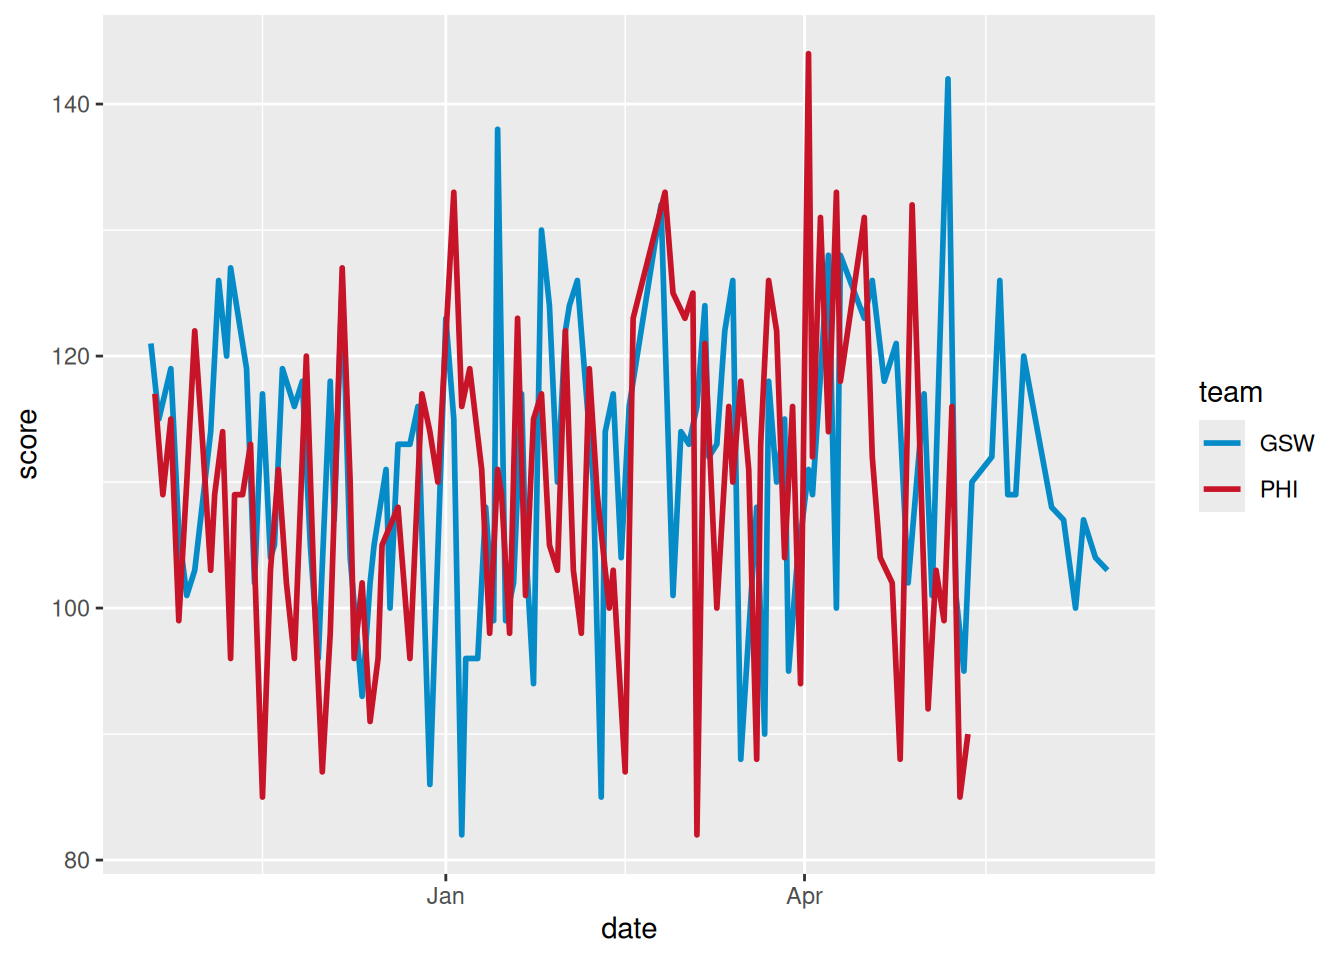
color
dg = dd %>%
  filter(team %in% c('PHI', 'GSW'))

ggplot(dg, aes(x = date,
               y = score,
               color = team))+
  geom_line()
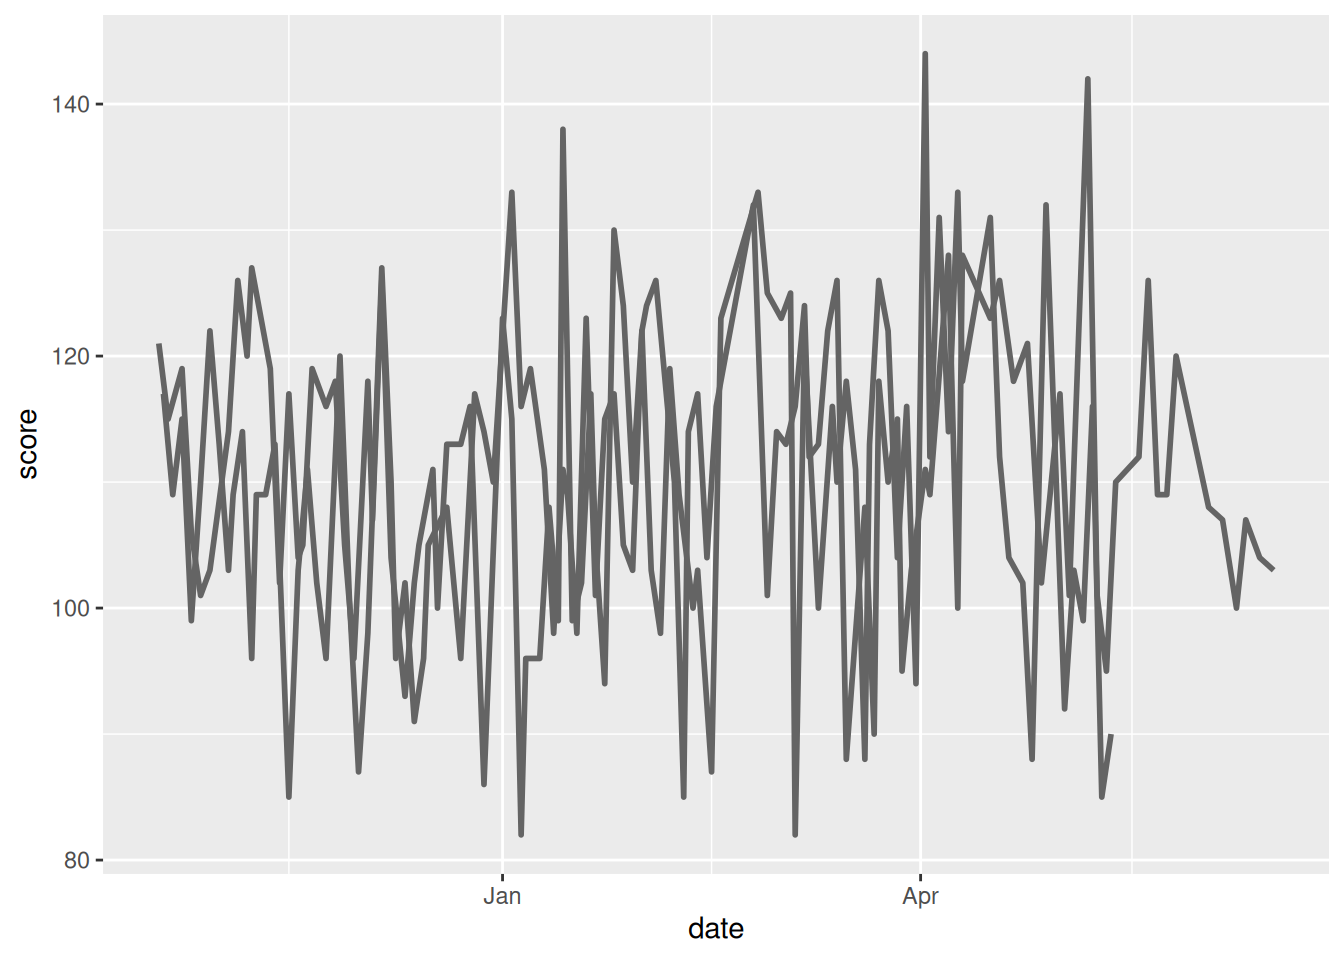
That automatically groups by the color variable. You can also supply just group and get two lines with the same color.
dg = dd %>%
  filter(team %in% c('PHI', 'GSW'))

ggplot(dg, aes(x = date,
               y = score,
               group = team))+
  geom_line()