B.13 Side-by-side bar charts with position_dodge
Stacked bar are often not desired, so you can use position_dodge to make the bars side-by-side.
Code
## remove teams with no `post` data.
dg = dd %>%
  group_by(team, season.type) %>%
  summarise(score = sum(score))

post.teams = unique(dg$team[dg$season.type == 'post'])
dg = dg %>% filter(team %in% post.teams)

## plot
g = ggplot(dg, aes(x = score,
                   y = team,
                   fill = season.type))+
  geom_col(position = position_dodge(),
           color = NA)

g %>%
  pub(type = 'bar')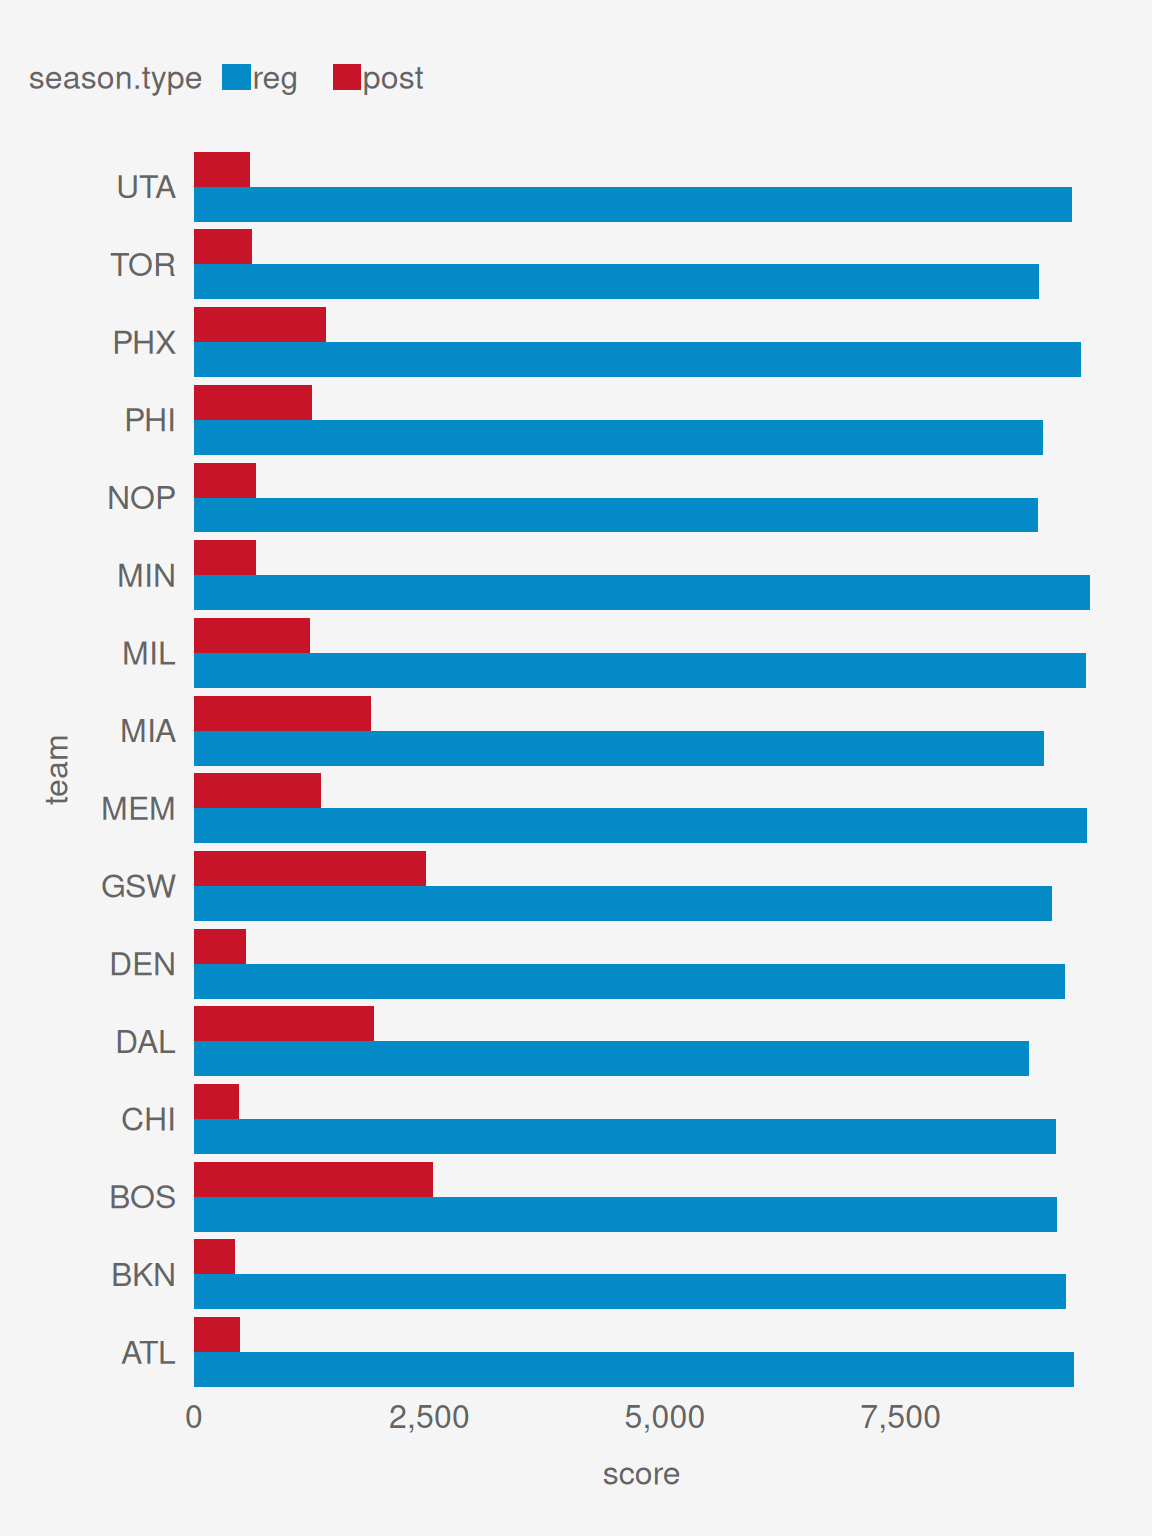
[1] 85.89991
[1] 80
[1] 20
[1] 185.8999