B.9 Scatter plot with geom_jitter
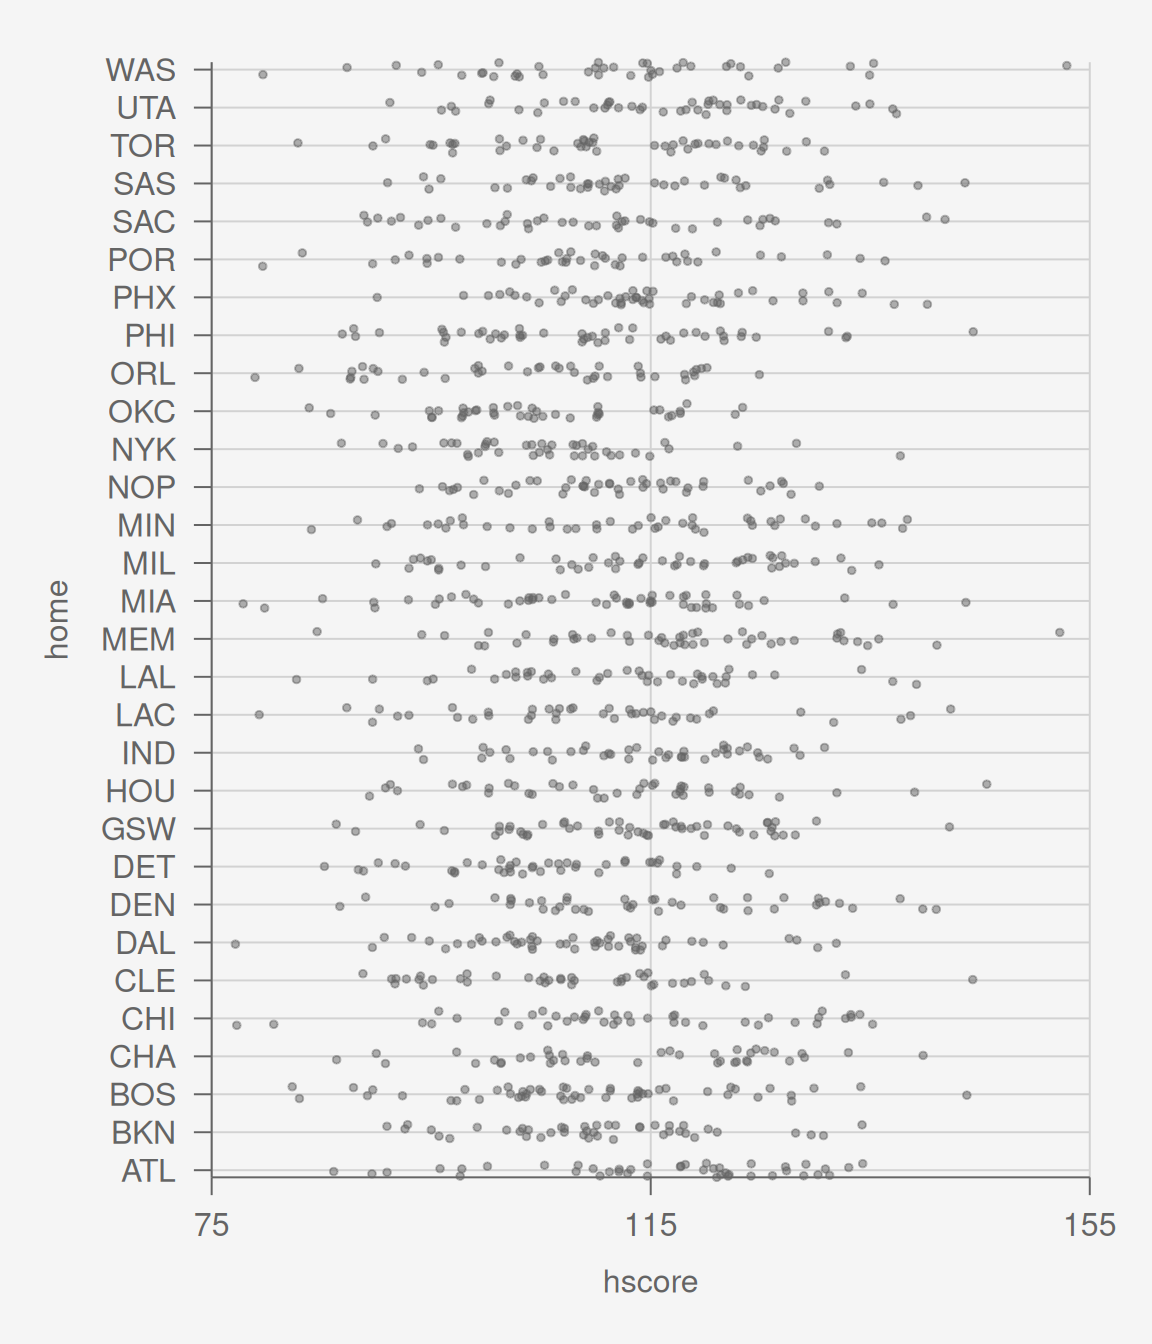
When there are a lot of overlapping points in a plot, it can also help to use geom_jitter in place of geom_point.
We use geom_jitter to add randomness to the points so that don’t overlap as much. Here we add a little randomness in the vertical direction, and none on the horizontal direction. This is often useful when plotting discrete variables. We include alpha = 0.5 and size = 1 as well, which make the points transparent and smaller.
Code
[1] 85.89991
[1] 80
[1] 20
[1] 185.8999