B.7 Faceting with facet_wrap
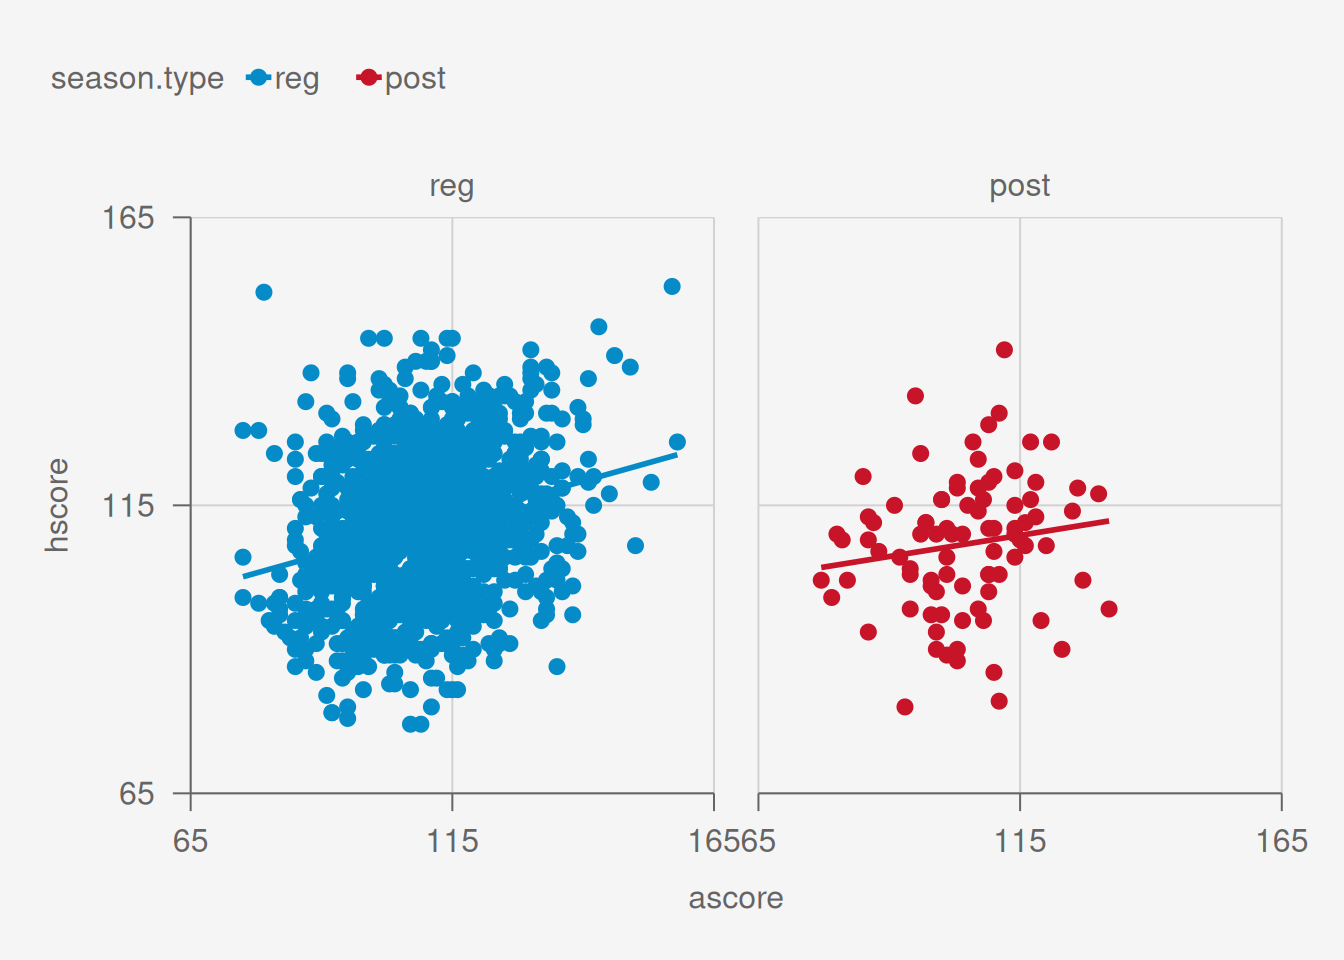
For categorical variables, we can create a separate window for each value of that variable. Here we make separate scatter plots for each season.type, reg and post. Note that if we use geom_smooth, there’s a line for each window and color.
Code
[1] 57.35768
[1] 80
[1] 20
[1] 157.3577