6.2 Level 2 and Level 3 stations
Code
dg = d %>%
  pivot_longer(cols = c(lev2, lev3)) %>%
  filter(value != 0) %>%
  mutate(name = ifelse(name == 'lev2',
                       'Level 2',
                       'Level 3'))

title = "Level 2 and Level 3 Charging Stations in US and Canada"

g = ggplot(dg,
           aes(x     = lon,
               y     = lat,
               size  = value,
               color = name))+
  borders('state',
          colour = publightgray)+
  geom_point(alpha = .1,
             show.legend = F)+
  facet_wrap(~name)+
  labs(title = title)

g %>%
  pub('map') +
  scale_size(range = c(.75, 3))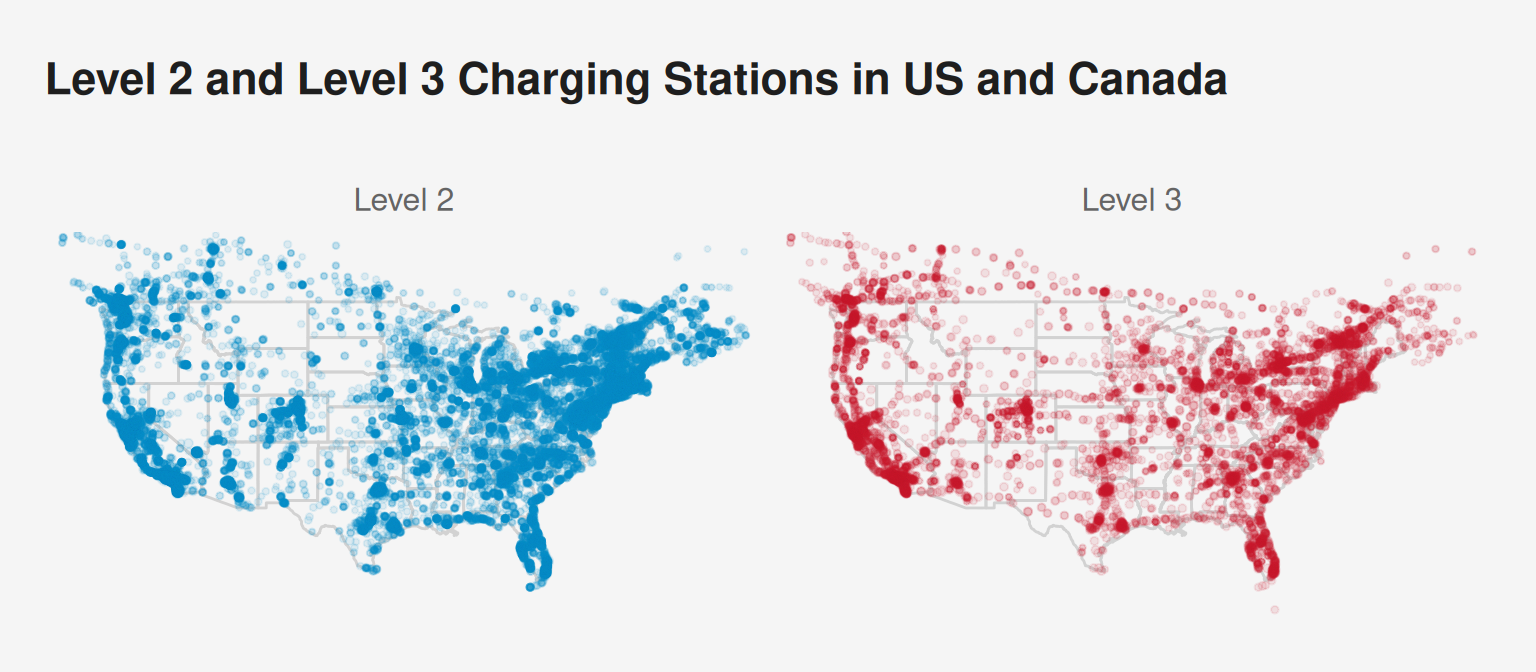
[1] 0
[1] 80
[1] 20
[1] 100