15.2 Linear regression with a continuous predictor
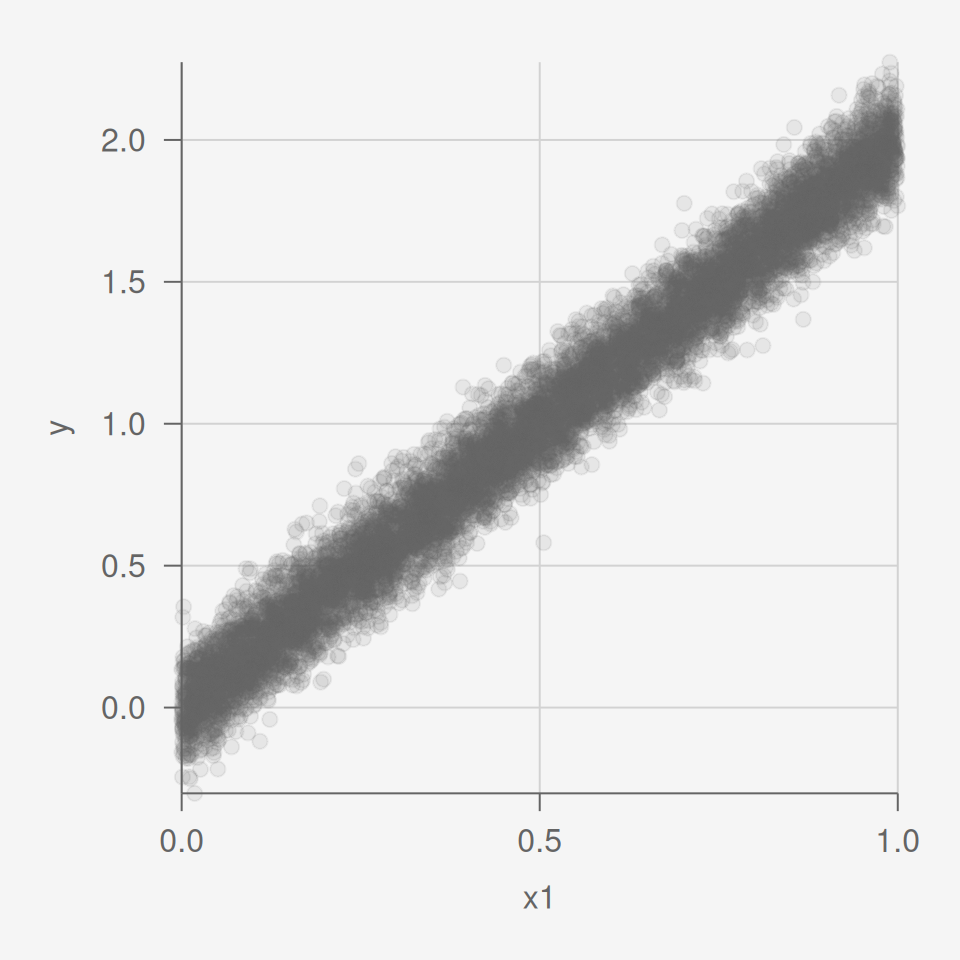
Simulate \(y\) data for the simple linear regression model with one continuous predict \(x_1\), \[y \sim N(\mu, \sigma^2), \\ \quad \mu = \beta_0 + \beta_1x + \epsilon, \quad \epsilon \sim N(0, .1^2),\]
and then plot.
Code
[1] 49.99122
[1] 80
[1] 20
[1] 149.9912