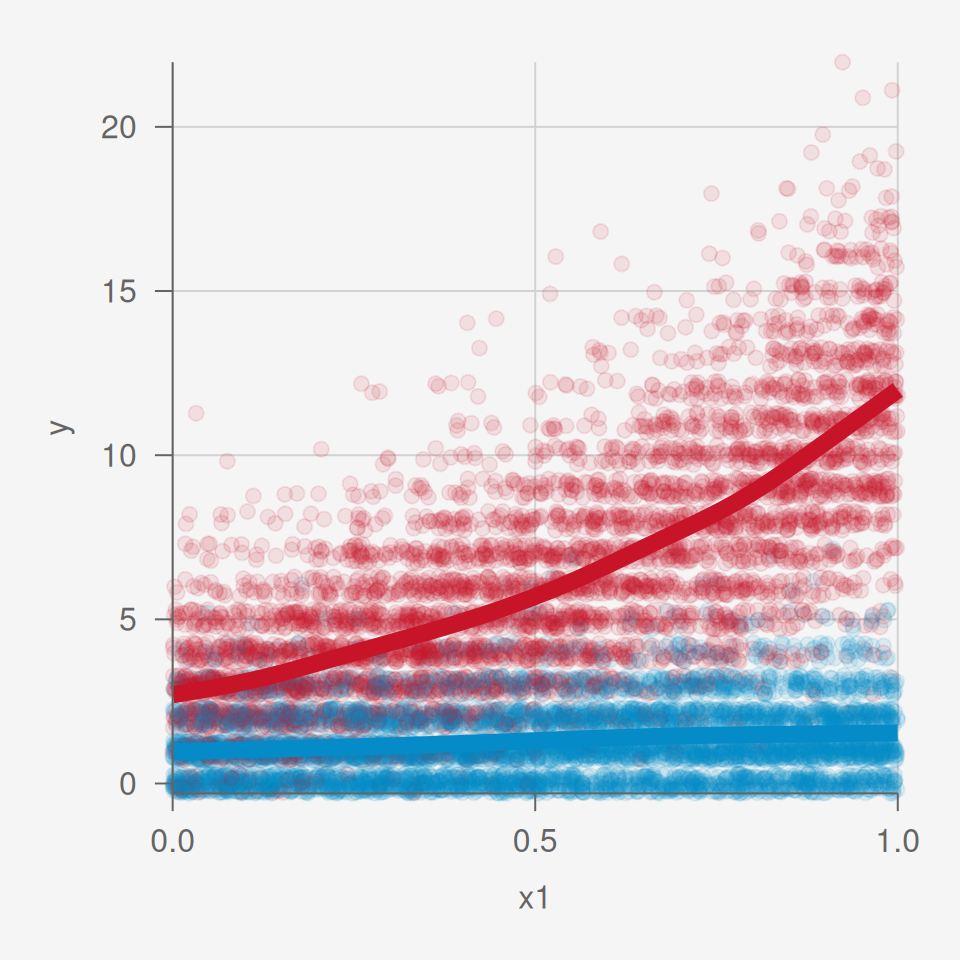
dg$y = rpois(n = n,
             lambda = exp(0 + 0.5*x1 + 1*x2 + 1*x1*x2))

g = ggplot(dg,
           aes(x = x1,
               y = y,
               color = as.factor(x2))) +
  geom_jitter(show.legend = F,
              alpha  = 0.1,
              width  = 0,
              height = 0.3) +
  geom_smooth(show.legend = F,
              linewidth   = 3)

g %>%
  pub(xlim = c(0,1))