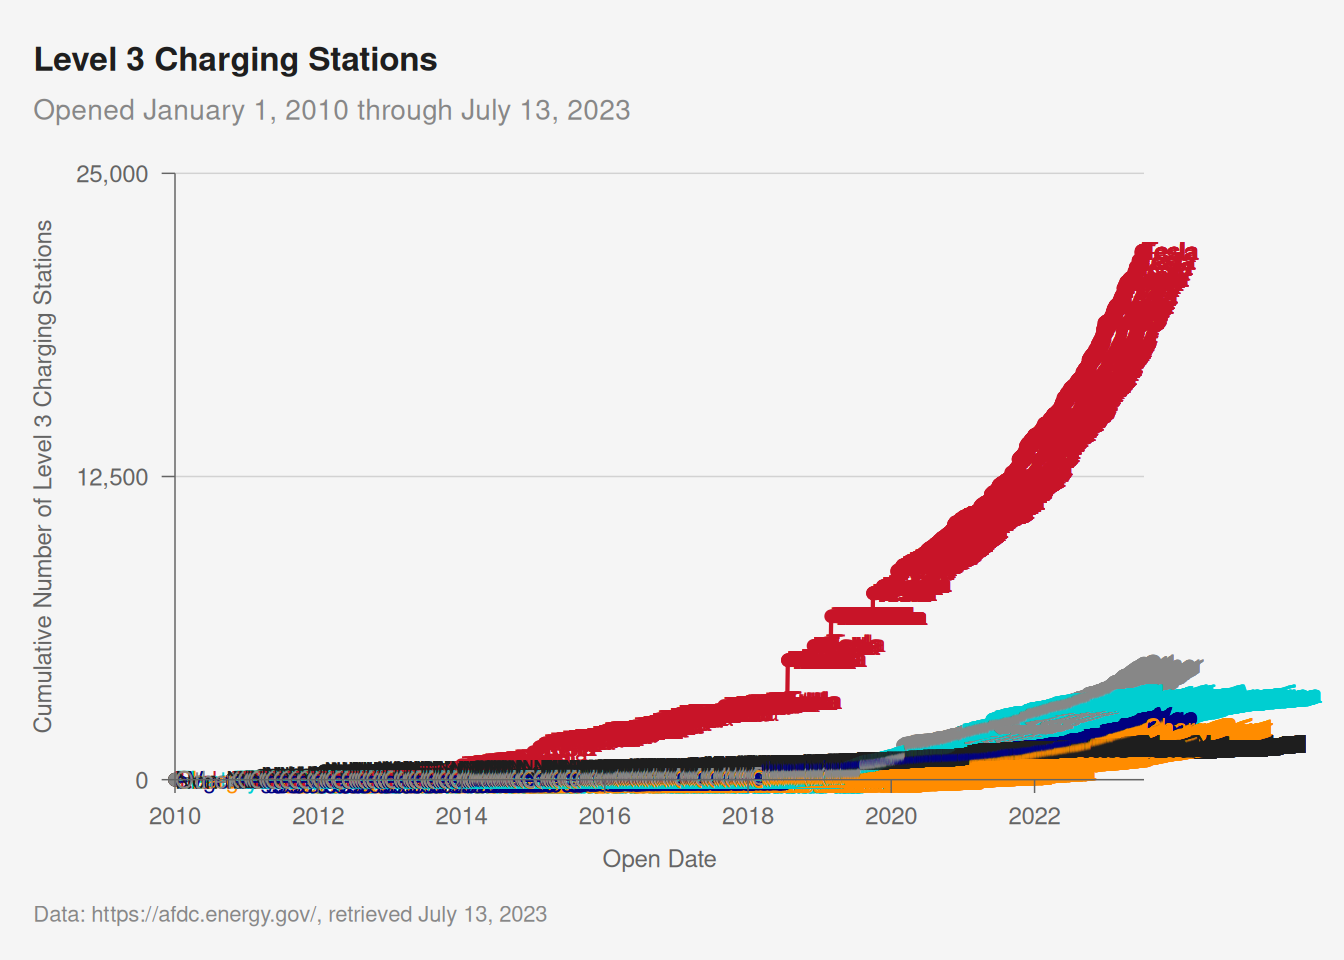
7.3 Level 3 Cumulative Stations Line Animation
Let’s animate it. First a static version with points shown.
Code
[1] 100
[1] 80
[1] 20
[1] 200
Code
gg = g %>%
  pub('line',
      ylim = c(0, 25000),
      base_size = 36) +
  # geom_point(show.legend = F) + ## point at each frame
  # geom_text(show.legend = F,
  #           hjust       = 0,
  #           nudge_x     = 100) +
  theme(plot.margin = margin(t =  70*1/72,
                             r = 300*1/72,
                             b =  50*1/72,
                             l =  50*1/72,
                             unit = 'in')) +
   transition_reveal(open.date)

# other animation settings
## 2 frames/month, aka 6 months/sec, plus a 5 second pause
## use same number of frames as maps
## using dd here since dg doesn't have month.year
# nframes = length(levels(dd$month.year))*2
# a3 = animate(gg,
#              width   = 1440,
#              height  = 1440,
#              fps     = 12,
#              nframes = nframes,
#              start_pause = 0,
#              end_pause   = 0)
# a3
#
# # ## save animation
# anim_save(a3, filename = 'img/cumulative.EV.stations.animation3.gif')
[1] 100
[1] 80
[1] 20
[1] 200
library(tidyverse)
library(pubtheme)
knitr::opts_chunk$set(
  echo    = TRUE,        ## show or suppress the code
  include = TRUE ,       ## show or suppress the output
  message = FALSE,       ## omit messages generated by code
  warning = FALSE,       ## omit warnings generated by code
  comment = NA,          ## removes the ## from in front of outputs
  error   = F,           ## stop on errors
  # cache   = T,         ## cache time consuming code

  fig.align  = "center", ## centers all figures
  fig.height = 5,        ## set the default height
  fig.weight = 5         ## set the default width
  )