7.1 Level 2 Cumulative Charging Stations Over Time
Code
dg = d %>%
  filter(status == 'avail',
         open.date >= '2010-01-01',
         lev2 > 0) %>%
  group_by(open.date,
           network2) %>%
  summarise(lev2 = sum(lev2, na.rm=T)) %>%
  ungroup() %>%
  complete(open.date,
           network2,
           fill = list(lev2 = 0)) %>%
  arrange(open.date) %>%
  group_by(network2) %>%
  mutate(cumul.lev2 = cumsum(lev2))

tail(dg,10)

dmax = dg %>%
  filter(cumul.lev2 == max(cumul.lev2),
         open.date  == max(open.date))
dmax
# A tibble: 10 × 4
# Groups: network2 [6]
open.date network2 lev2 cumul.lev2
<date> <fct> <dbl> <dbl>
1 2023-09-01 Tesla 0 14931
2 2023-09-01 Blink 0 11058
3 2023-09-01 FLO 0 6180
4 2023-09-01 Other 0 24223
5 2023-11-14 ChargePoint 0 58642
6 2023-11-14 Non-Networked 0 23085
7 2023-11-14 Tesla 0 14931
8 2023-11-14 Blink 0 11058
9 2023-11-14 FLO 0 6180
10 2023-11-14 Other 20 24243
# A tibble: 6 × 4
# Groups: network2 [6]
open.date network2 lev2 cumul.lev2
<date> <fct> <dbl> <dbl>
1 2023-11-14 ChargePoint 0 58642
2 2023-11-14 Non-Networked 0 23085
3 2023-11-14 Tesla 0 14931
4 2023-11-14 Blink 0 11058
5 2023-11-14 FLO 0 6180
6 2023-11-14 Other 20 24243Code
library(grid)
title = "Level 2 Charging Stations, Jan 1, 2010 thru Jul 13, 2023"
g = ggplot(dg,
           aes(x = open.date,
               y = cumul.lev2,
               color = network2,
               label = network2))+
  geom_text(data = dmax, hjust = 0, show.legend = F, nudge_x = 100)+
  geom_line(show.legend = F)+
  geom_point(data = dmax, show.legend = F)+
  labs(title    = title,
       caption  = 'As of July 13, 2023. Data: https://afdc.energy.gov/',
       x = 'Open Date',
       y = 'Cumulative Number of Level 2 Charging Stations')+
  scale_x_date(
    # limits = as.Date(c('2010-01-01',
    #                    '2023-01-15')),
               breaks = seq.Date(from = as.Date('2010-01-01'),
                                 to   = as.Date('2023-07-13'),
                                 by   = 'year'),
               date_labels = '%Y') +
  scale_y_continuous(labels = comma,
                     limits = c(0, 54000),
                     breaks = c(0, 27000, 54000))+
  scale_color_manual(values = c('orange',
                                pubdarkgray,
                                pubred,
                                'forestgreen',
                                pubblue,
                                pubmediumgray))

g %>%
  pub('line',
      ylim = c(0, 60000),
      ybreaks = c(0, 2e4, 4e4, 6e4)) +
  theme(legend.title = element_blank(),
        plot.margin  = margin(t =  70*1/72*12/36,
                              r = 300*1/72*12/36,
                              b =  50*1/72*12/36,
                              l =  50*1/72*12/36,
                              unit = 'in'))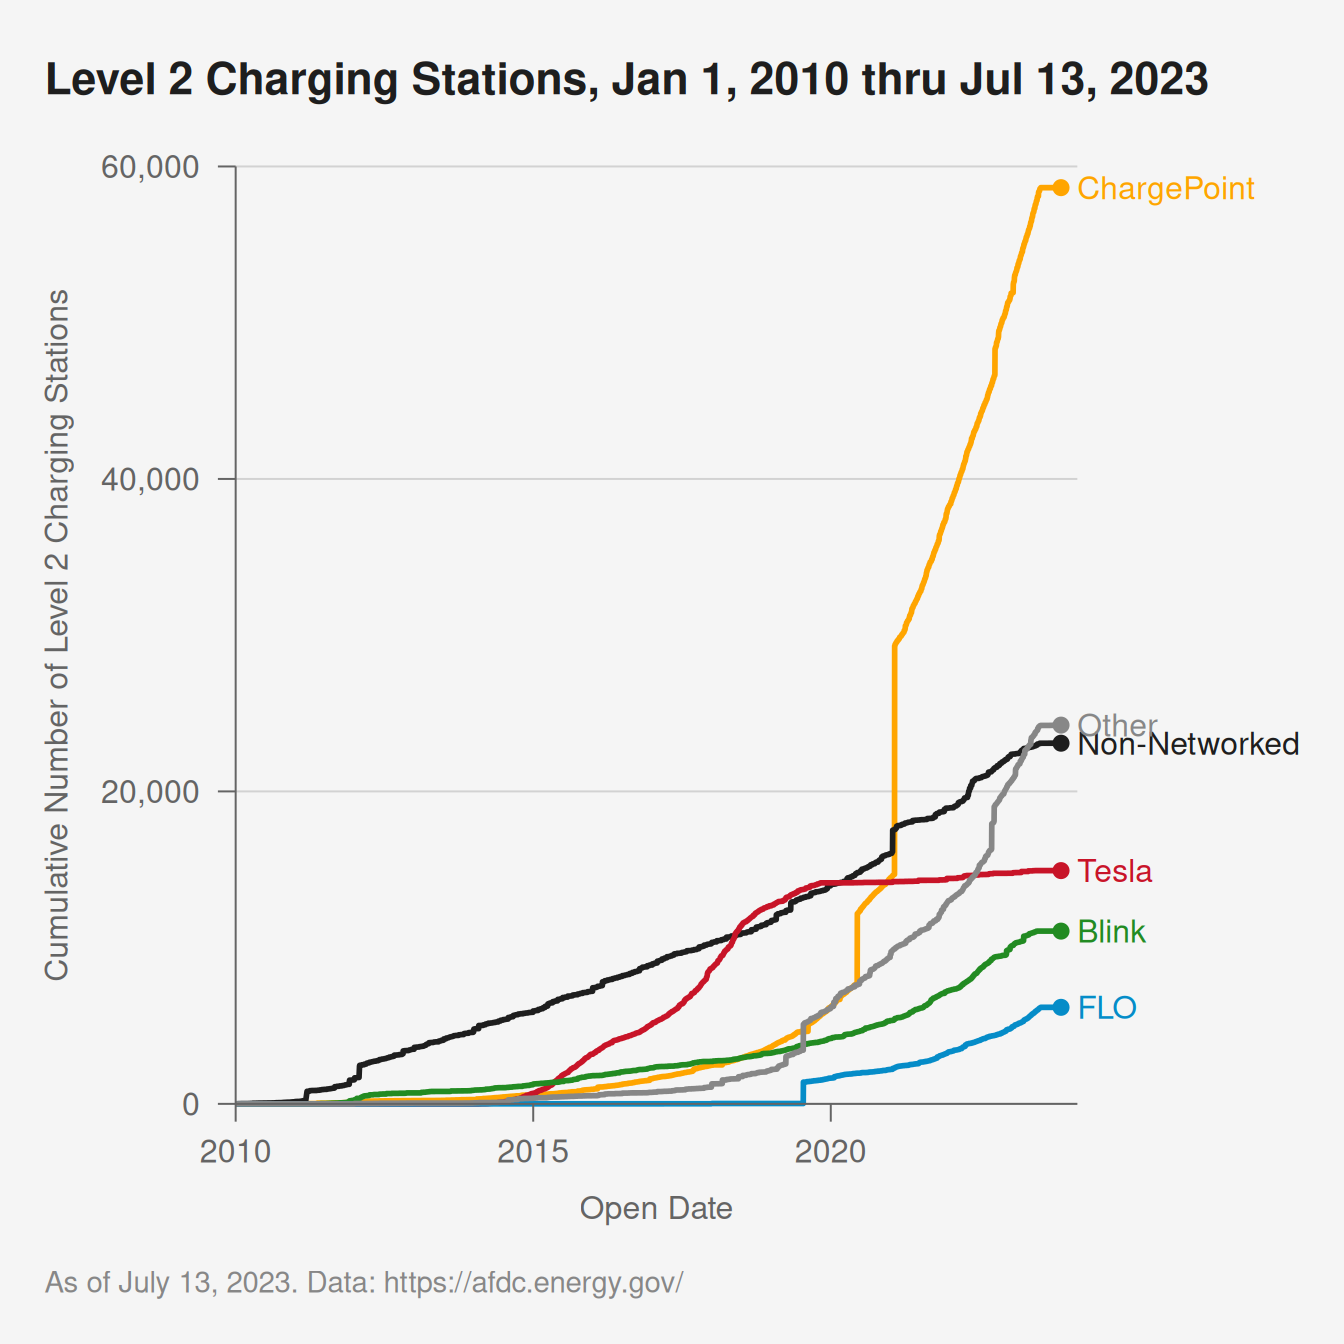
[1] 100
[1] 80
[1] 20
[1] 200