gganimate
lmer
=
<-
.
_
pubtheme
tidyverse
DT
tidycensus
ggplot
plot.lm
methods
getAnywhere
browser()
debug
debugonce
foreach
rbind
dplyr
filter
select
str
mutate
arrange
summarise
reframe
bind_rows
group_by
ifelse
pivot_wider
pivot_longer
left_join
geom_point
ggsave
geom_smooth
group
facet_wrap
alpha
geom_jitter
geom_hex
geom_col
fill
position_dodge
geom_text
geom_histogram
geom_line
geom_tile
theme
ggplotly
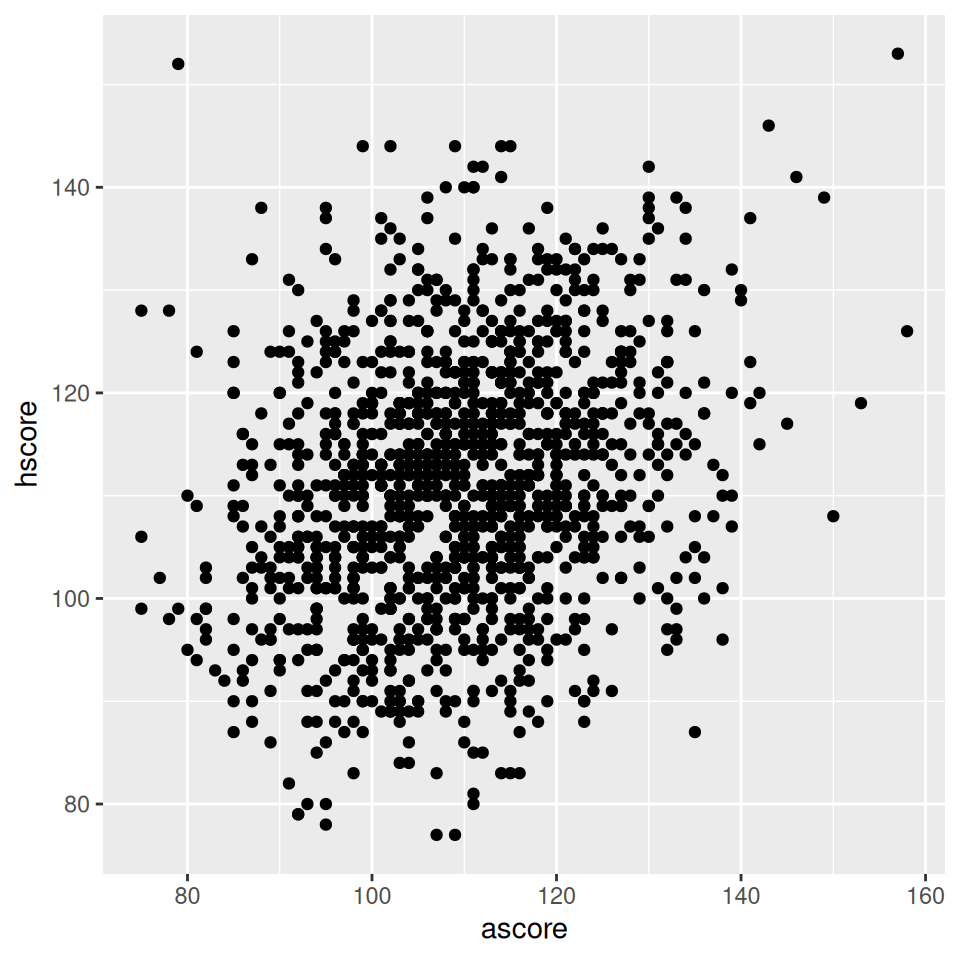
ggplot(d, aes(x = ascore, y = hscore))+
  geom_point()