7.2 Level 3 Cumulative Charging Stations Over Time
Code
dg = d %>%
  filter(status    == 'avail',
         open.date >= '2010-01-01',
         lev3      >  0) %>%
  group_by(open.date,
           network3) %>%
  summarise(lev3 = sum(lev3, na.rm = T)) %>%
  ungroup() %>%
  complete(open.date,
           network3,
           fill = list(lev3 = 0)) %>%
  arrange(open.date) %>%
  group_by(network3) %>%
  mutate(cumul.lev3 = cumsum(lev3))

tail(dg,12)

dmax = dg %>%
  filter(cumul.lev3 == max(cumul.lev3),
         open.date  == max(open.date))
dmax
# A tibble: 12 × 4
# Groups: network3 [6]
open.date network3 lev3 cumul.lev3
<date> <fct> <dbl> <dbl>
1 2023-07-12 Tesla 0 21812
2 2023-07-12 Electrify America 0 3542
3 2023-07-12 eVgo 10 2618
4 2023-07-12 ChargePoint 9 2166
5 2023-07-12 Non-Networked 0 1469
6 2023-07-12 Other 3 4778
7 2023-07-13 Tesla 0 21812
8 2023-07-13 Electrify America 0 3542
9 2023-07-13 eVgo 0 2618
10 2023-07-13 ChargePoint 2 2168
11 2023-07-13 Non-Networked 0 1469
12 2023-07-13 Other 12 4790
# A tibble: 6 × 4
# Groups: network3 [6]
open.date network3 lev3 cumul.lev3
<date> <fct> <dbl> <dbl>
1 2023-07-13 Tesla 0 21812
2 2023-07-13 Electrify America 0 3542
3 2023-07-13 eVgo 0 2618
4 2023-07-13 ChargePoint 2 2168
5 2023-07-13 Non-Networked 0 1469
6 2023-07-13 Other 12 4790Code
title = "Level 3 Charging Stations"
g = ggplot(dg, # %>% filter(open.date>='2023-07-01'),
           aes(x     = open.date,
               y     = cumul.lev3,
               color = network3,
               group = network3,
               label = network3))+
  # geom_text(data  = dmax,
  #           hjust = 0,
  #           show.legend = F,
  #           nudge_x     = 100)+
  geom_line(show.legend = F)+
  geom_point(show.legend = F) + ## point at each frame
  geom_text(show.legend = F,
            hjust       = 0,
            nudge_x     = 0) +
  # geom_point(data = dmax,
  #             show.legend = F)+
  labs(title    = title,
       subtitle = 'Opened January 1, 2010 through July 13, 2023',
       caption  = 'Data: https://afdc.energy.gov/, retrieved July 13, 2023',
       x = 'Open Date',
       y = 'Cumulative Number of Level 3 Charging Stations')+
  scale_color_manual(
    values = c(pubred,
               'darkturquoise',
               'navy',
               'darkorange',
               pubdarkgray,
               pubmediumgray)) ## company colors

g %>%
  pub('line',
      ylim = c(0, 25000)) +
  theme(plot.margin = margin(t =  70*1/72/3,
                             r = 300*1/72/3,
                             b =  50*1/72/3,
                             l =  50*1/72/3,
                             unit = 'in'))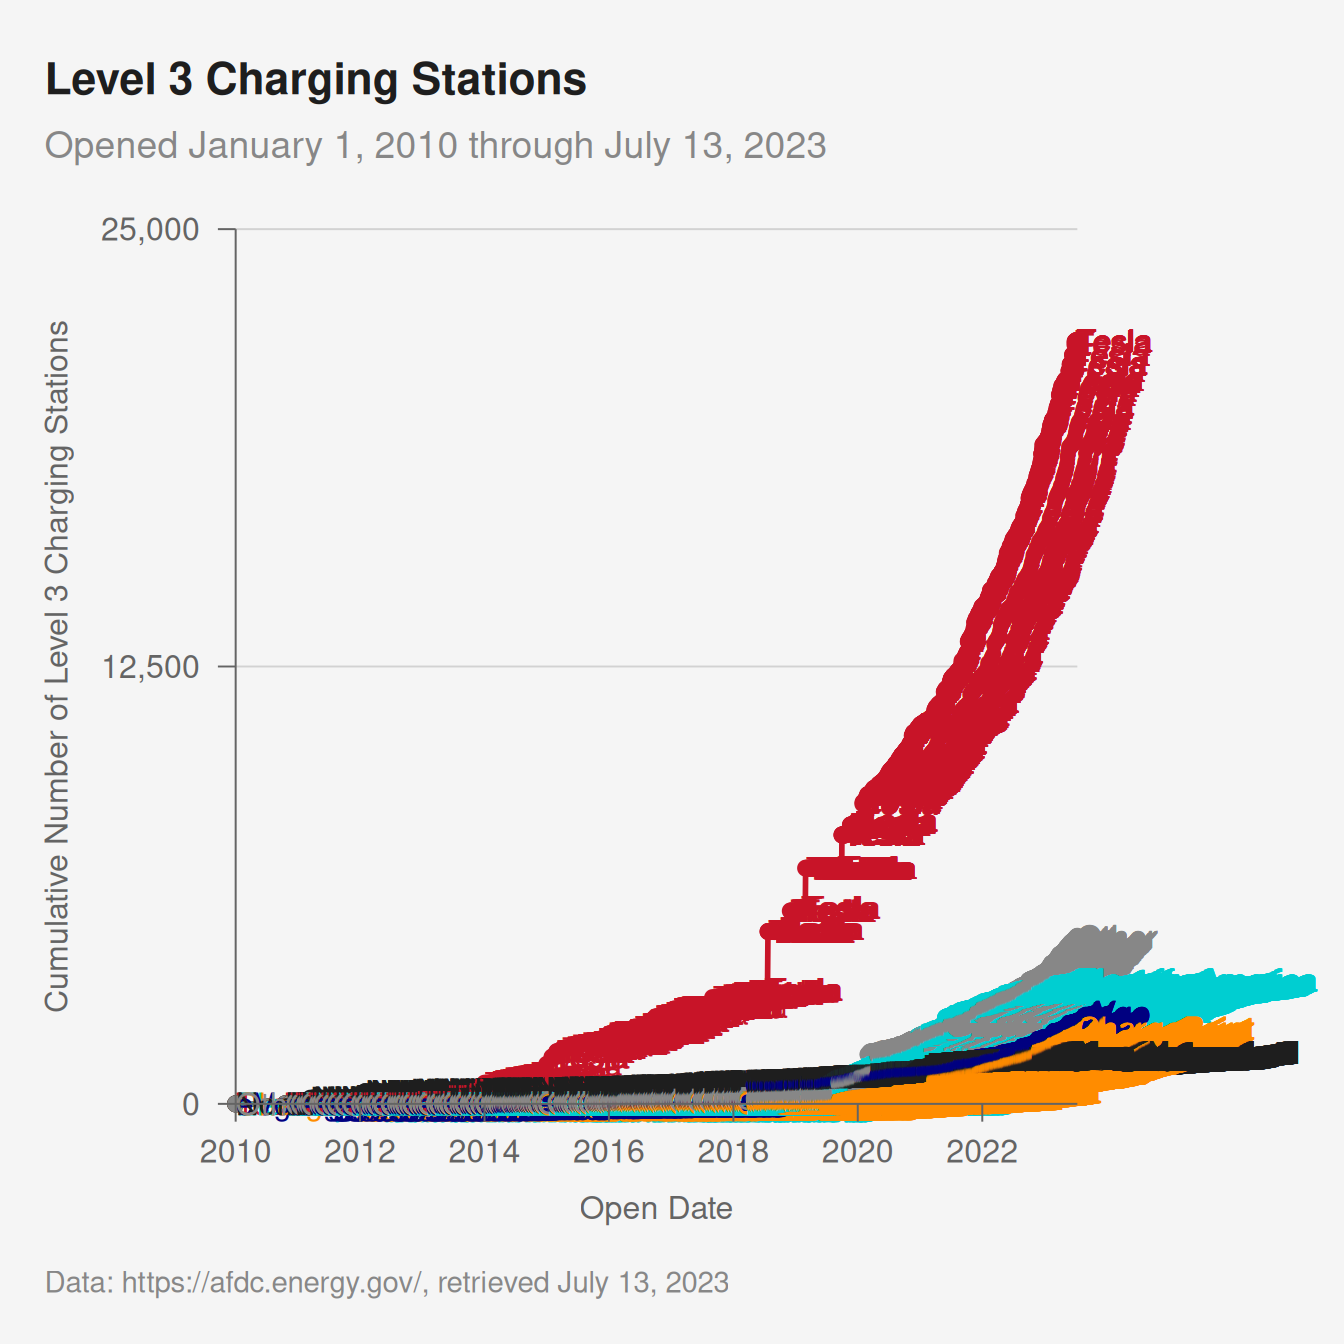
Code
# gg = g %>%
#   pub('line',
#       base_size = 36,
#       ylim = c(0, 25000)) +
#   theme(plot.margin = margin(t =  70*1/72,
#                              r = 300*1/72,
#                              b =  50*1/72,
#                              l =  50*1/72,
#                              unit = 'in'))
#
# ggsave(filename=paste0("img/", gsub("%", " Perc", title), ".jpg"),
#        plot   = gg,
#        width  = 20,
#        height = 20,
#        units  = 'in',
#        dpi    = 72)
[1] 100
[1] 80
[1] 20
[1] 200