Code
plot(cars)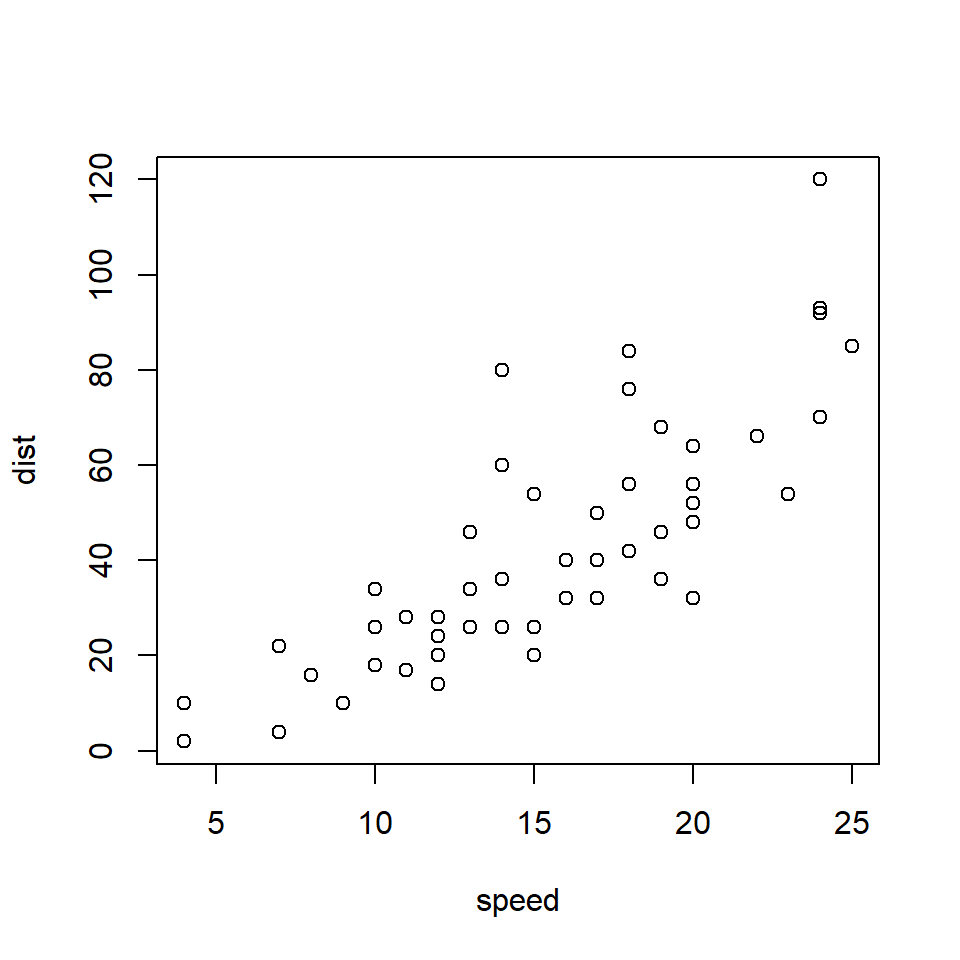
This is a Quarto book.
To learn more about Quarto books visit https://quarto.org/docs/books.
Here is an easy plot
plot(cars)
A ggplot version of the same plot.
library(ggplot2)

ggplot(cars, aes(x = speed, y = dist)) +
    geom_point()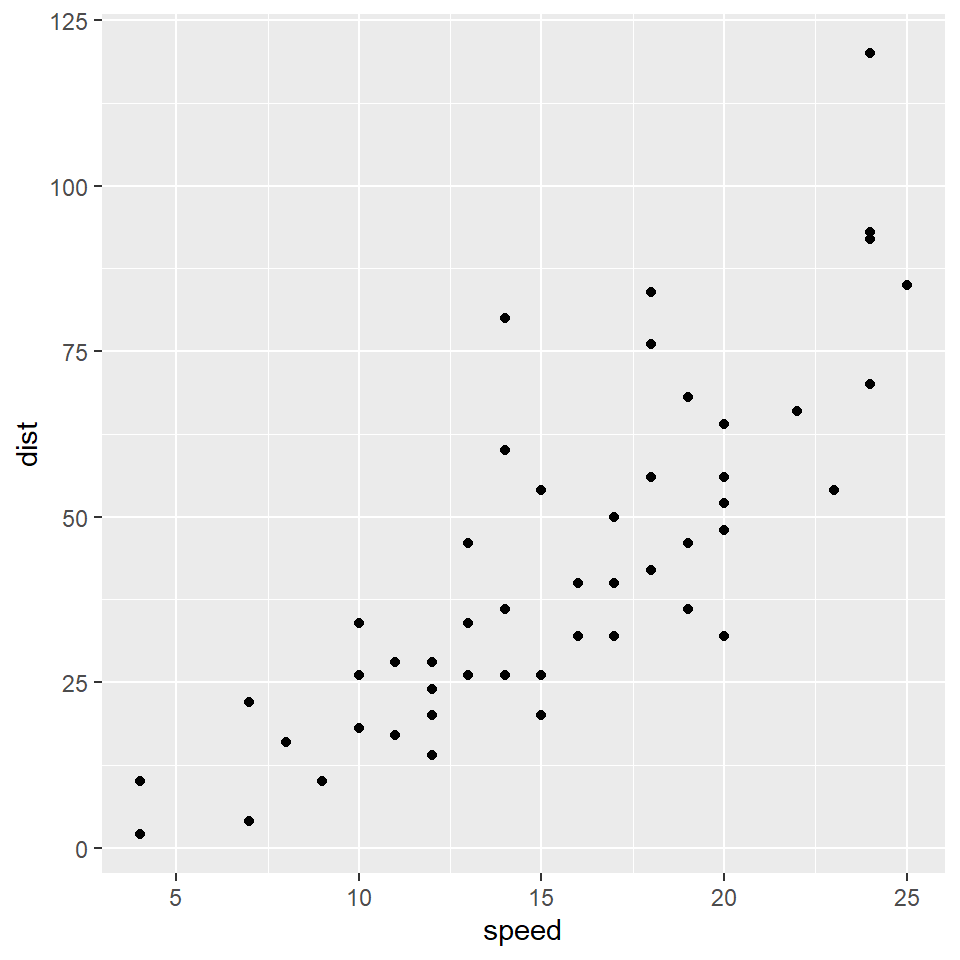
library(pubtheme)
dg = mtcars %>%
  select(wt, mpg, cyl) %>%
  mutate(Cylinders = as.factor(cyl)) %>%
  rename(MPG = mpg)

title = "Title in Upper Lower"
g = ggplot(dg,
           aes(x     = wt,
               y     = MPG,
               color = Cylinders,
               size  = MPG)) +
  geom_point() +
  labs(title    = title,
       subtitle = 'Optional Subtitle In Upper Lower',
       caption  = "Optional caption giving more info, X handle, or shameless promotion of pubtheme",
       x = 'Horizontal Axis Label in Upper Lower',
       y = 'Vertical Axis Label in Upper Lower')

g %>%
  pub(xlim = c(0, 6),
      ylim = c(0, 40))
Here is an easy computation:
1 + 1[1] 2Here is an easy plotly plot:
library(plotly)
plot_ly(data = iris, x = ~Sepal.Length, y = ~Petal.Length, color = ~Species)