12.6 ggplot versions of plot.lm
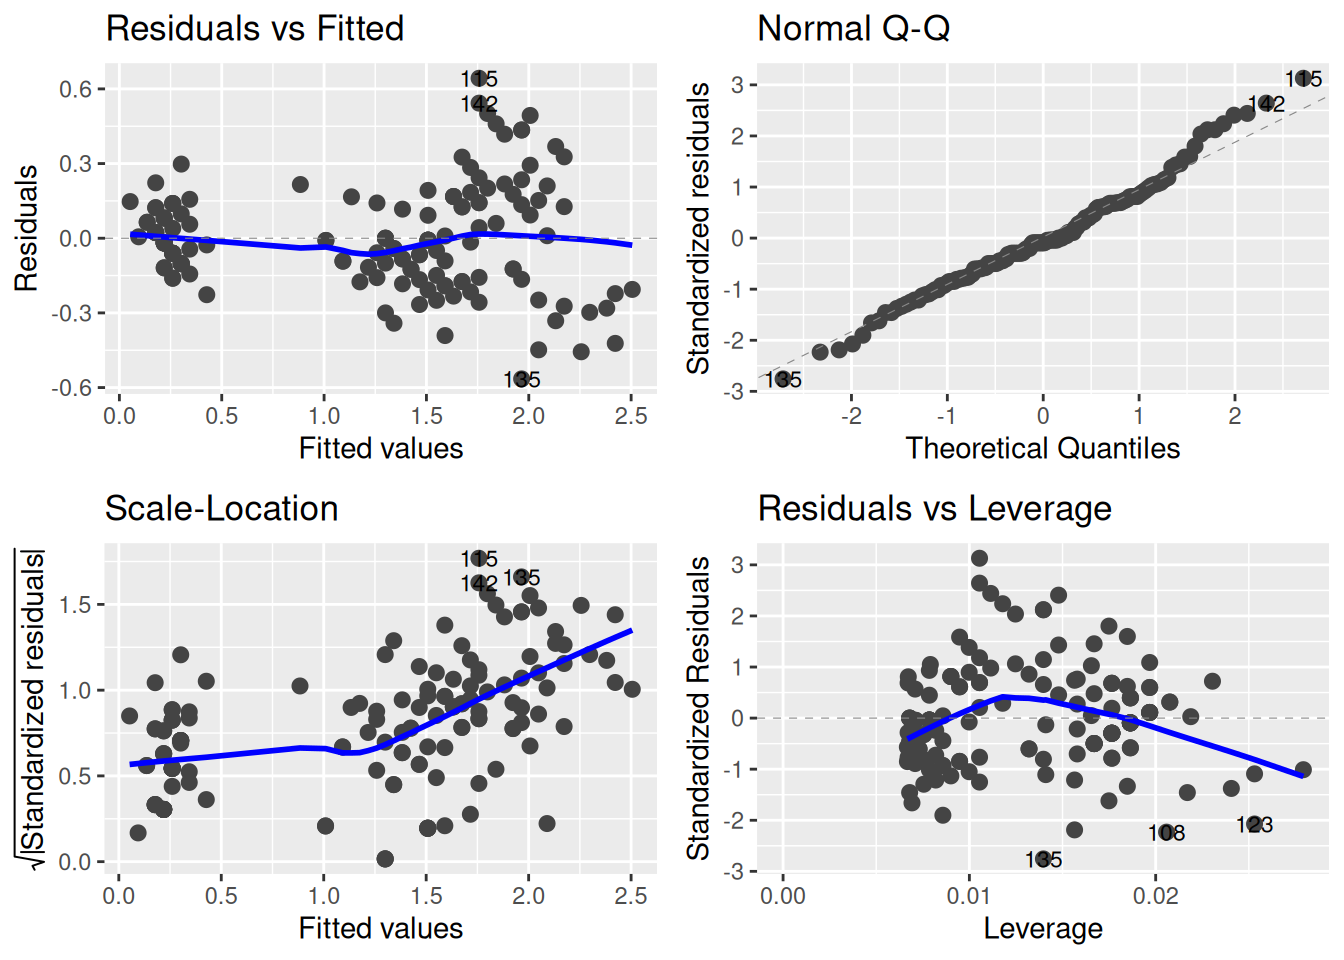
If you are interested in creating diagnostic plots like plot(lm1), but in the style of ggplot, you can use the package ggfortify and the function autoplot:
Code
For more info, including the function fortify see here:
- https://cran.r-project.org/web/packages/ggfortify/vignettes/basics.html
- https://cran.r-project.org/web/packages/ggfortify/vignettes/plot_lm.html