13.11 Splines
Just realized why the natural splines we were using did not have straight lines near the extremes. There is a Boundary.points argument to the ns function. Outside of those points, the spline will be linear. But the default setting is the end points of the data, so we never saw the linear part. If you set the Boundary.pointsto be, say, 1/10 and 9/10th percentiles, then you see straight lines at the ends.
Here is some code, though this uses fake data, not real NBA data
Code
library(splines)

## Generate fake data
set.seed(123)
n=200
x = rnorm(n)
y = 1-.25*x^2 + rnorm(n,0,1)
d = data.frame(x=x, y=y)
head(d)

## Choose df
df=5     ## number of knots
df2=df*2 ## for calculating b.knots3

## Define boundaries, outside of these it will be linear
## For b.knots3, the linear part will be half as long
b.knots2 = quantile(d$x, c(1/df , (df -1)/df )) ## e.g. 1/5 and 4/5
b.knots3 = quantile(d$x, c(1/df2, (df2-1)/df2)) ## e.g. 1/10 and 9/10

## Models
m1 = lm(y ~ ns(x, df=df                             ), data=d) ## no linear
m2 = lm(y ~ ns(x, df=df-2, Boundary.knots = b.knots2), data=d)
m3 = lm(y ~ ns(x, df=df-2, Boundary.knots = b.knots3), data=d)
d$pred1 = predict(m1)
d$pred2 = predict(m2)
d$pred3 = predict(m3)

g = ggplot(d, aes(x=x, y=y))+
  geom_point(color='gray')+
  geom_line(aes(y=pred1), color='red'  , alpha=0.7, linewidth=1.5)+
  geom_line(aes(y=pred2), color='blue' , alpha=0.7, linewidth=1.5)+
  geom_line(aes(y=pred3), color='black', alpha=0.7, linewidth=1.5)
print(g)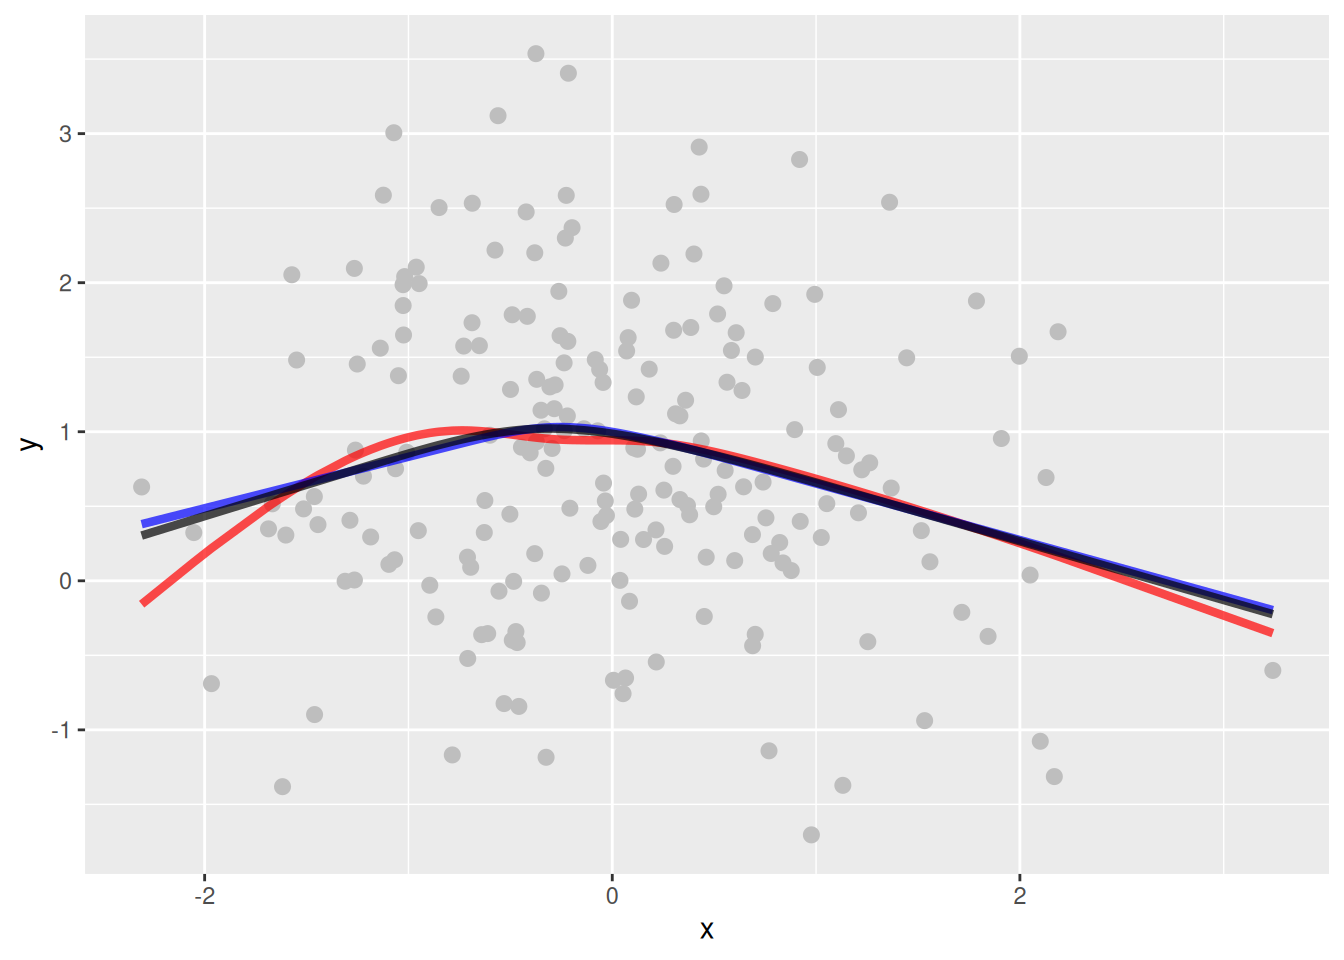
            x          y
1 -0.56047565  3.1202771
2 -0.23017749  2.2991676
3  1.55870831  0.1274620
4  0.07050839  1.5419512
5  0.12928774  0.5814812
6  1.71506499 -0.2116089