gganimate
lmer
=
<-
.
_
pubtheme
tidyverse
DT
tidycensus
ggplot
plot.lm
methods
getAnywhere
browser()
debug
debugonce
foreach
rbind
dplyr
filter
select
str
mutate
arrange
summarise
reframe
bind_rows
group_by
ifelse
pivot_wider
pivot_longer
left_join
geom_point
ggsave
geom_smooth
group
facet_wrap
alpha
geom_jitter
geom_hex
geom_col
fill
position_dodge
geom_text
geom_histogram
geom_line
geom_tile
theme
ggplotly
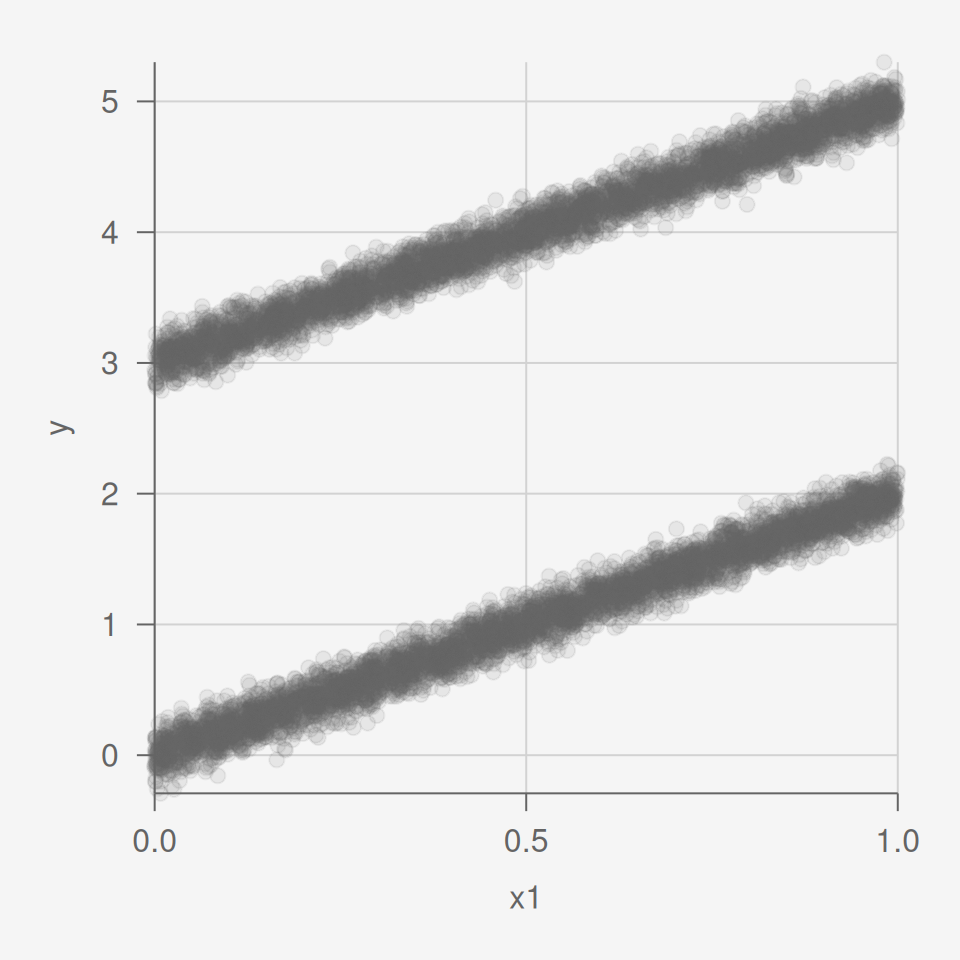
Simulate \(y\) data for a linear regression model with one continuous predictor \(x_1\) and one binary predicor \(x_2\). This has a varying intercept.
dg$y = 0 + 2*x1 + 3*x2 + rnorm(n, 0, .1)

g = ggplot(dg,
           aes(x1,
               y,
               group = x2))+
  geom_point(alpha = 0.1)

g %>%
  pub(xlim = c(0,1))
[1] 20
[1] 80
[1] 20
[1] 120