6.7 Level 3 Charging Stations Animation
Code
dg = dd %>%
  filter(lev3 >     0,
         lon  >= -127,
         lon  <=  -62,
         lat  >=   23,
         lat  <=   51
         )

title = "Level 3 Charging Stations as of {next_state}"

g = ggplot(dg,
           aes(x = lon,
               y = lat,
               color = network3,
               size  = lev3))+
  borders('usa',
          colour = publightgray)+
  geom_point(alpha = .4,
             show.legend = F)+
  facet_wrap(~network3)+
  labs(title   = title,
       caption = 'As of July 13, 2023. Data: https://afdc.energy.gov/')+
  scale_color_manual(values = c(pubred,          ## Tesla
                                'darkturquoise', ## Electrify America
                                'navy',          ## eVgo
                                'darkorange',    ## ChargePoint
                                pubdarkgray,     ## Non-networked
                                pubmediumgray))  ## Other

g %>%
  pub('map') +
  scale_size(range = c(.25, 2)) +
  theme(panel.spacing = unit(10*1/72/3, "in"))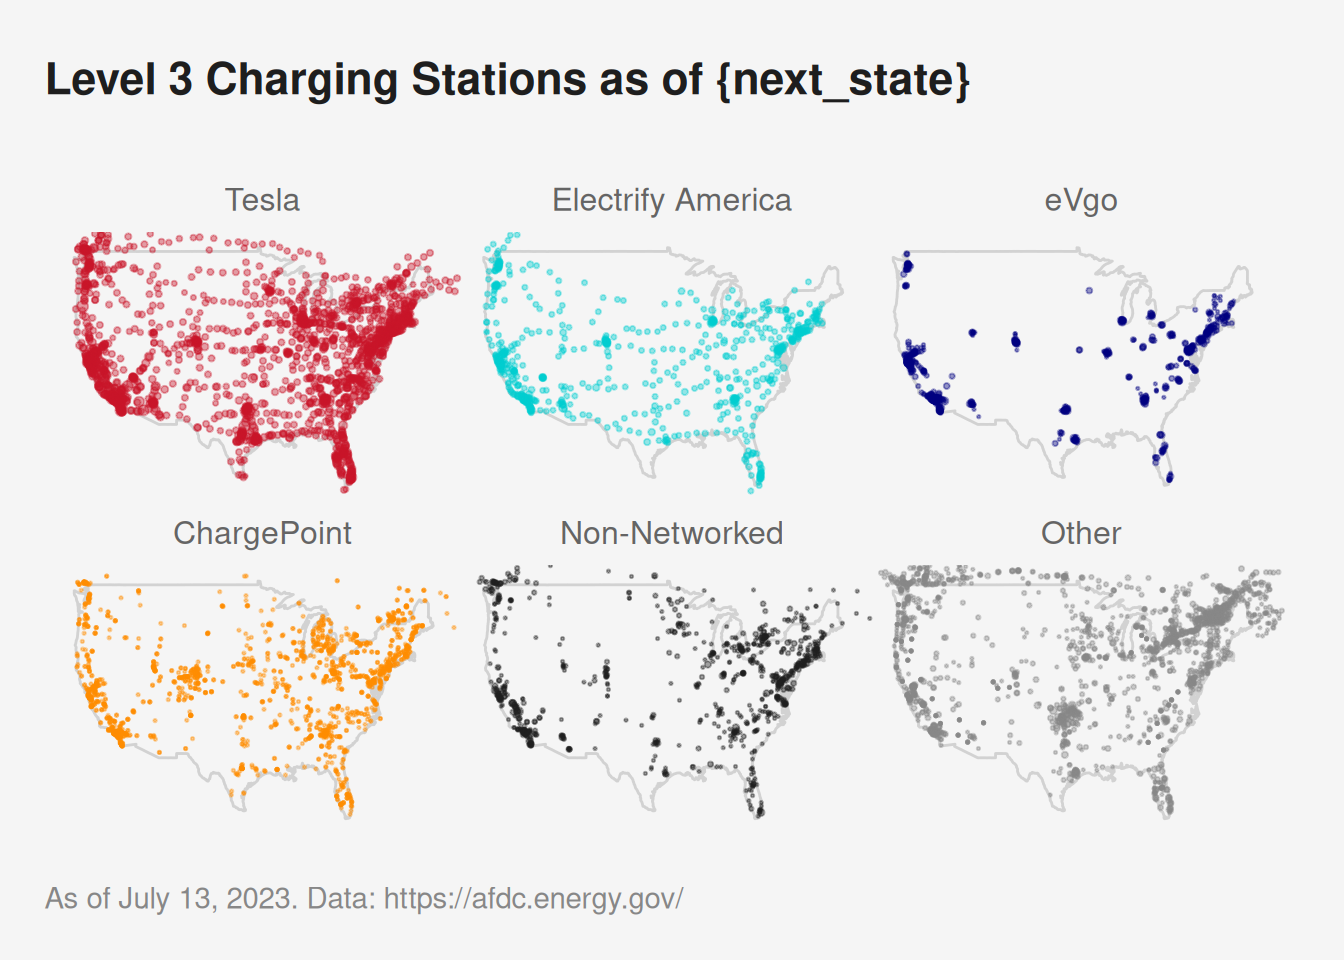
Code
gg = g %>%
  pub(type = 'map',
      base_size = 36) +
  scale_size(range = c(.5, 6)) +
  theme(panel.spacing = unit(10*1/72, "in")) +
  transition_states(states = month.year,
                    transition_length = 0,
                    state_length      = 1,
                    wrap = F) +
  shadow_mark()

## other animation settings
## 2 per month, aka 6 months per second, plus a 5 second pause at the end

# nframes = length(levels(dg$month.year))*2 + 12*5
#
# a3 = animate(gg,
#              width   = 1440,
#              height  = 1440*.7,
#              fps     = 12,
#              nframes = nframes,
#              start_pause = 0,
#              end_pause   = 12*5)
# a3
#
# ## save animation
# anim_save(a3, filename = 'img/EV.stations.animation.lev3.gif')
[1] 0
[1] 80
[1] 20
[1] 100
[1] 0
[1] 80
[1] 20
[1] 100