dg = mtcars %>%
select(wt, mpg, cyl)
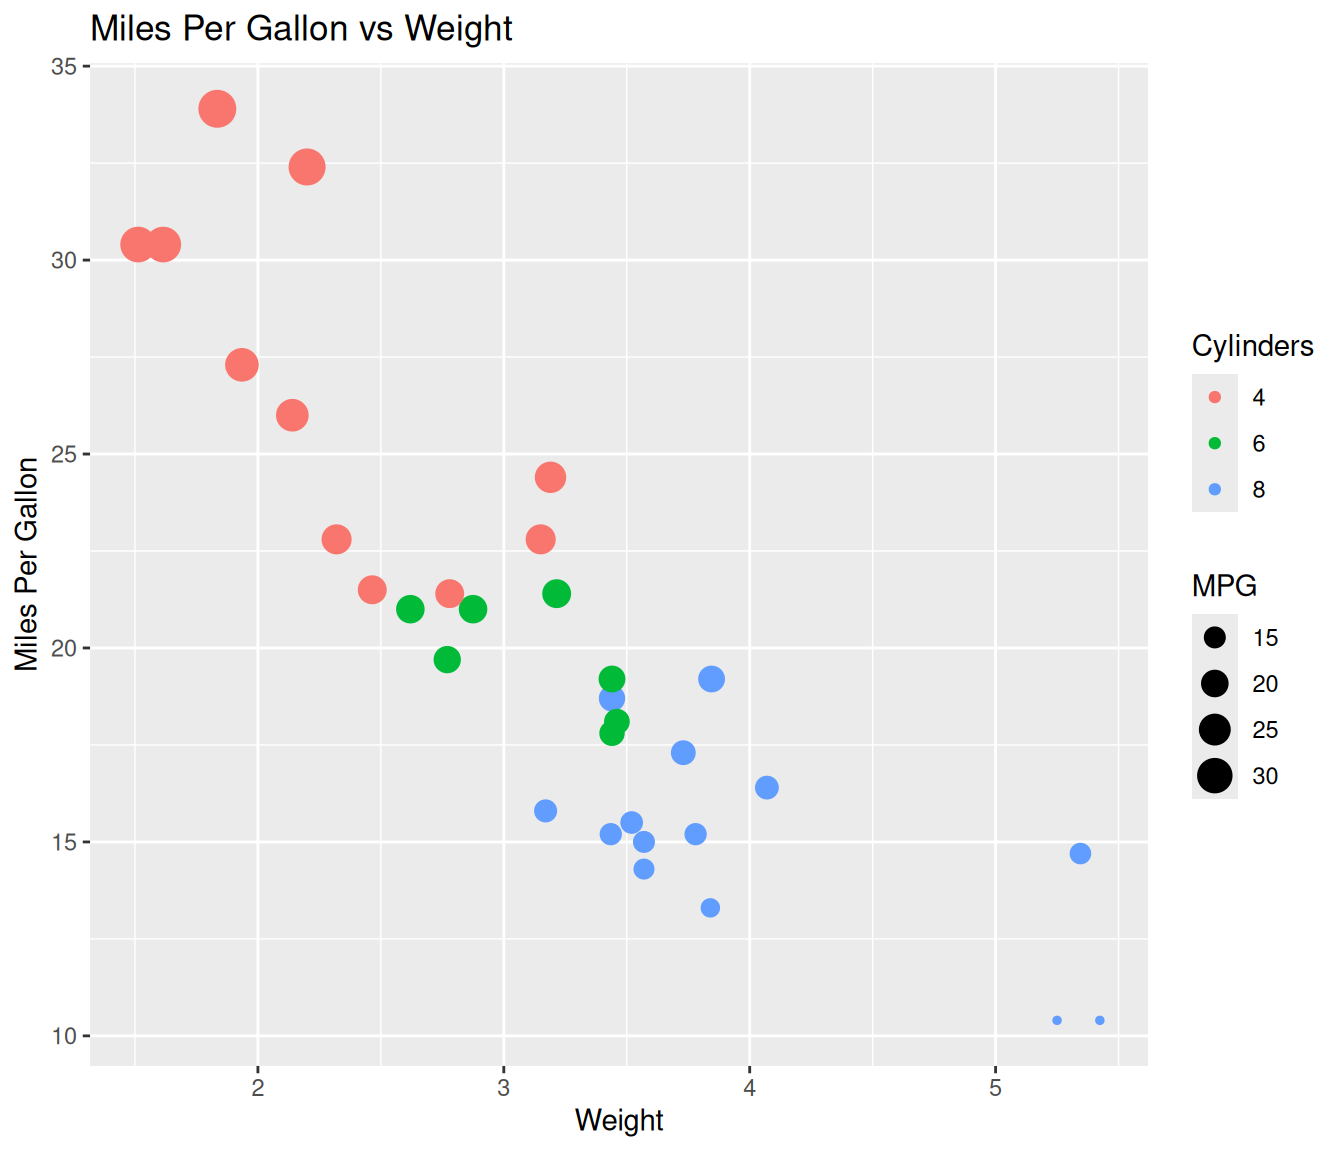
g = ggplot(mtcars,
aes(x = wt,
y = mpg,
color = as.factor(cyl)))+
geom_point(aes(size = mpg))+
labs(title = 'Miles Per Gallon vs Weight',
x = 'Weight',
y = 'Miles Per Gallon',
color = 'Cylinders',
size = 'MPG')
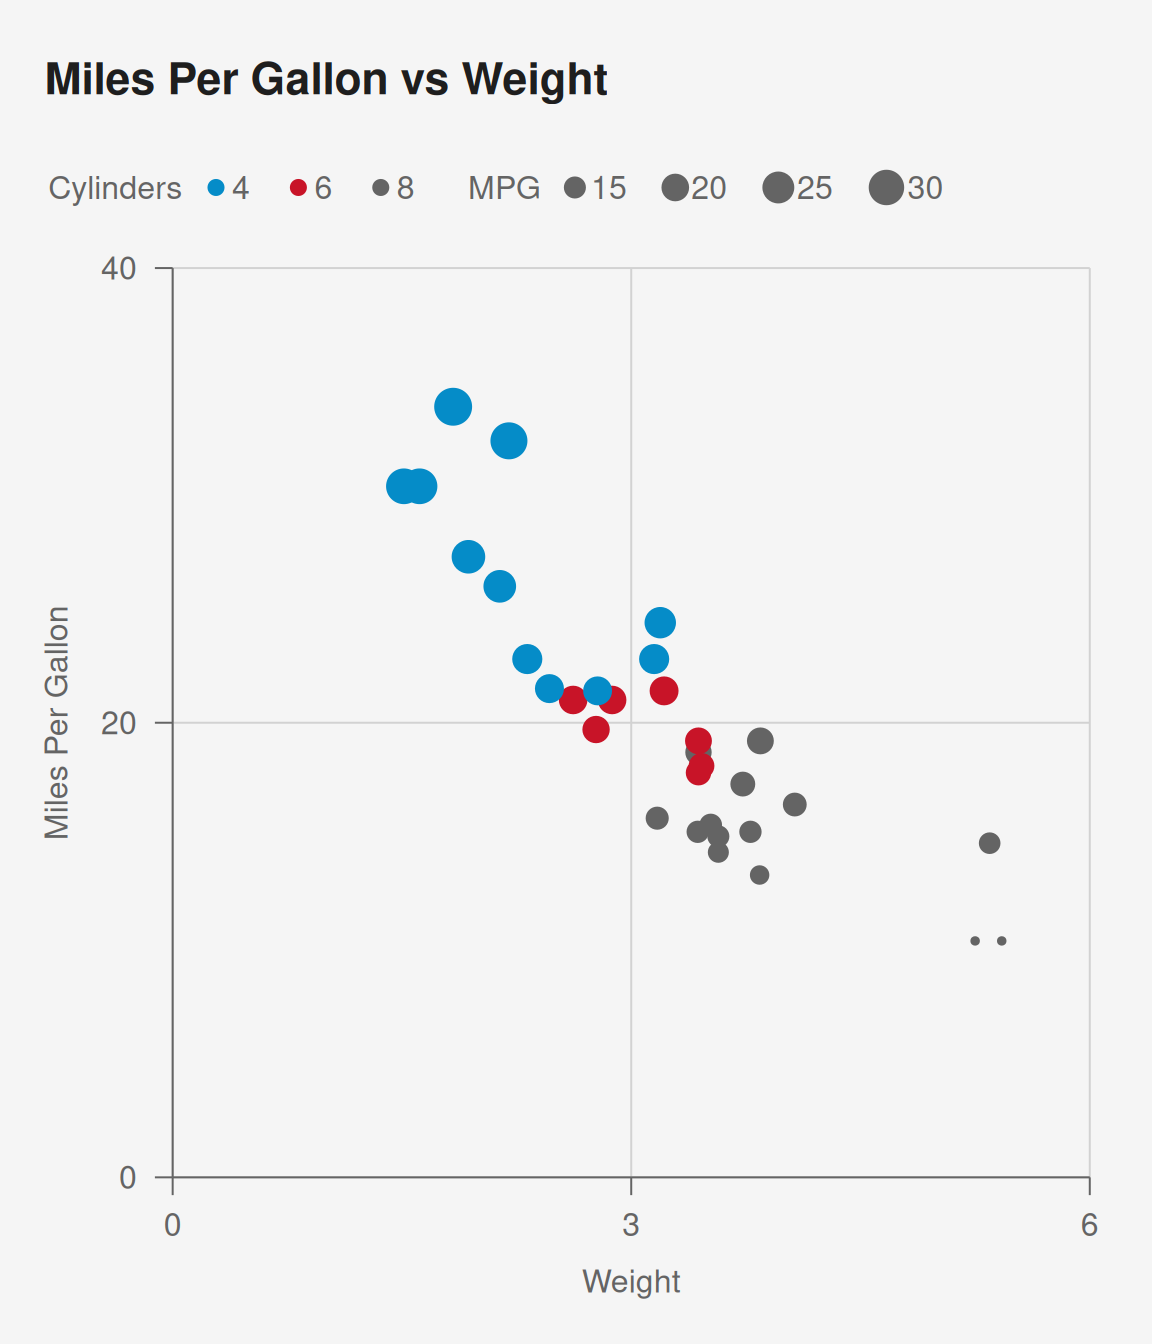
g %>%
pub(xlim = c(0, 6),
ylim = c(0, 40))