B.8 Transparency using alpha
If there are lots of overlapping points, and we can adjust the transparency using alpha.
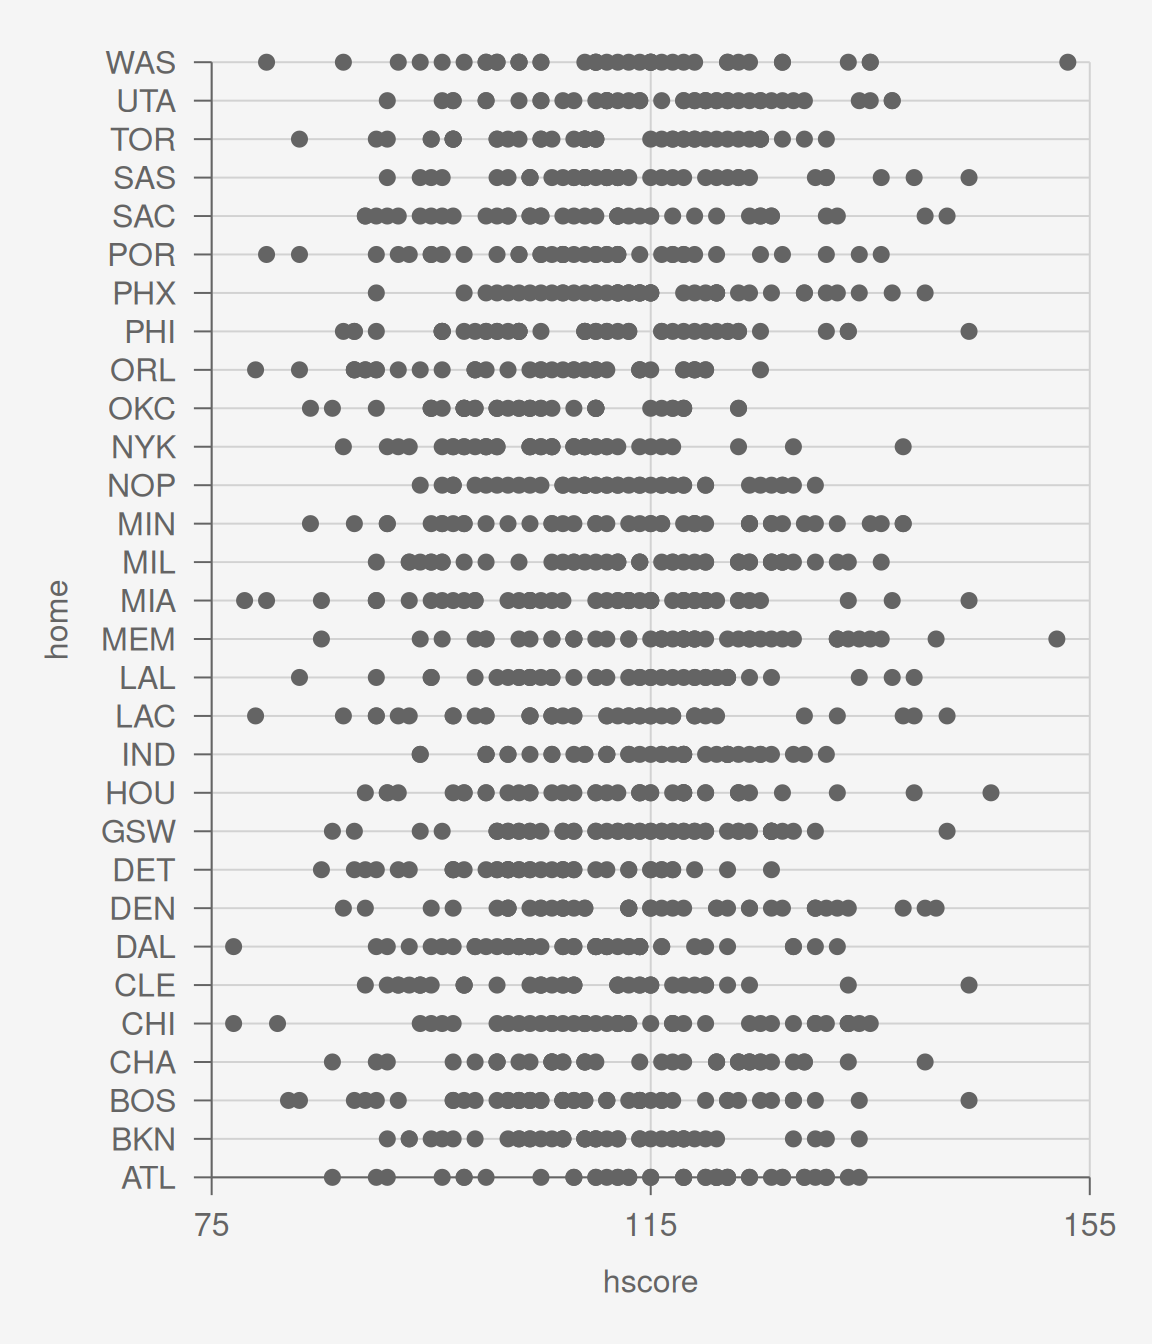
First here is a plot using geom_point that has a lot of points plotted on top of one another.
[1] 85.89991
[1] 80
[1] 20
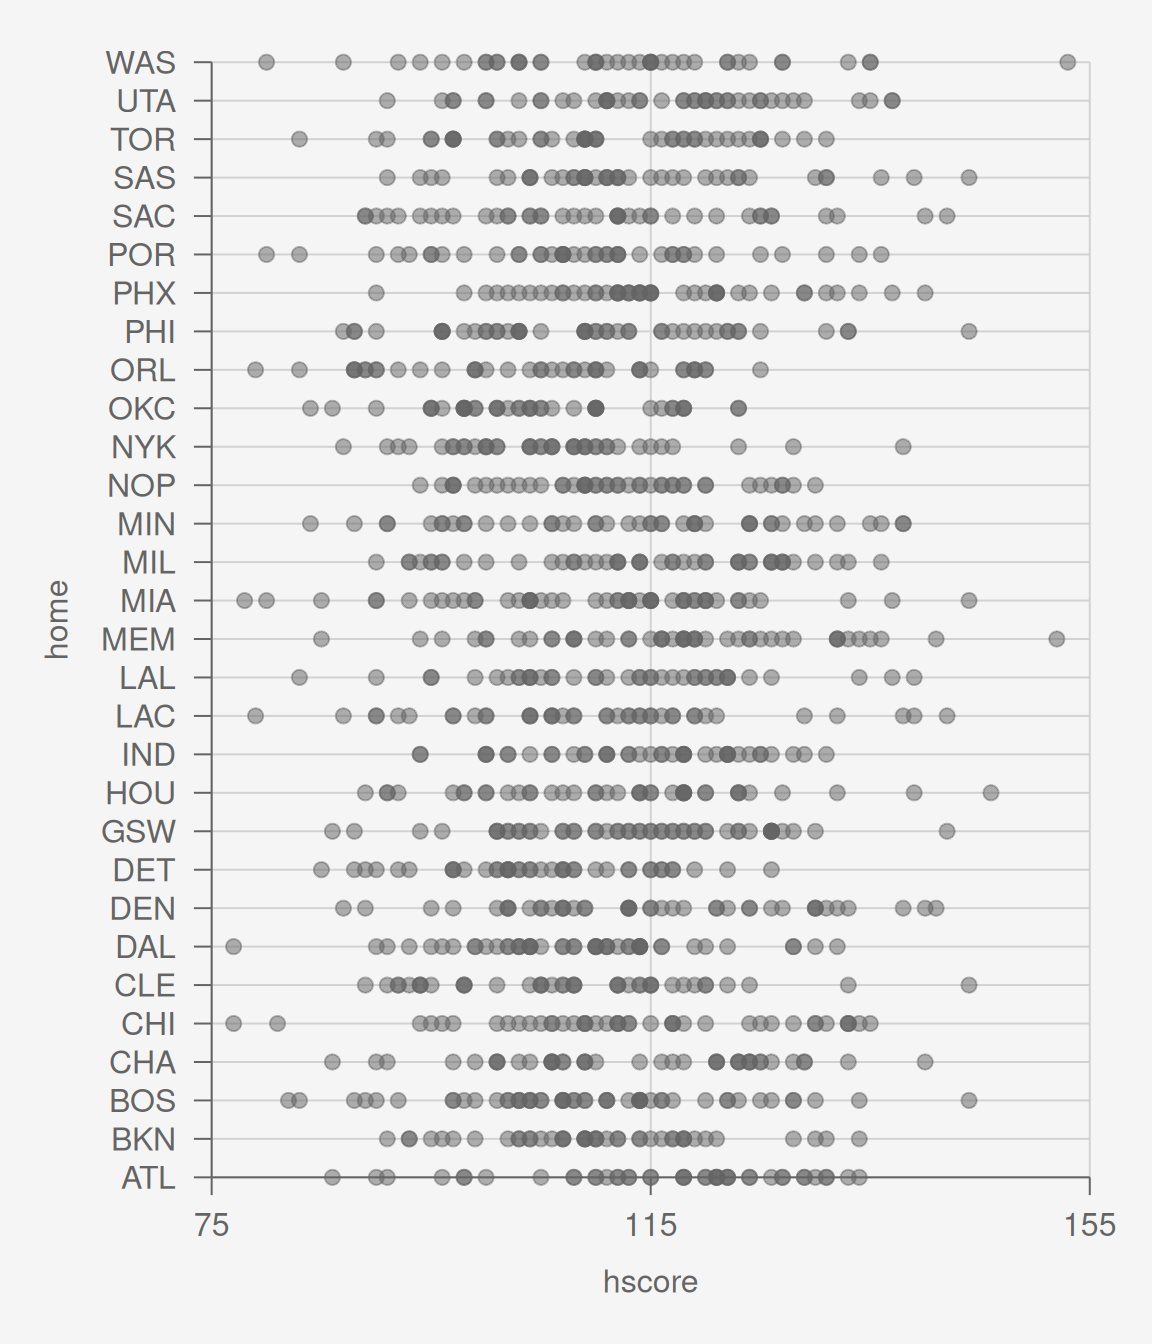
[1] 185.8999Now we add alpha = 0.5, which means we want points to be halfway between transparent and opaque (1 = opaque, 0 = transparent).
[1] 85.89991
[1] 80
[1] 20
[1] 185.8999