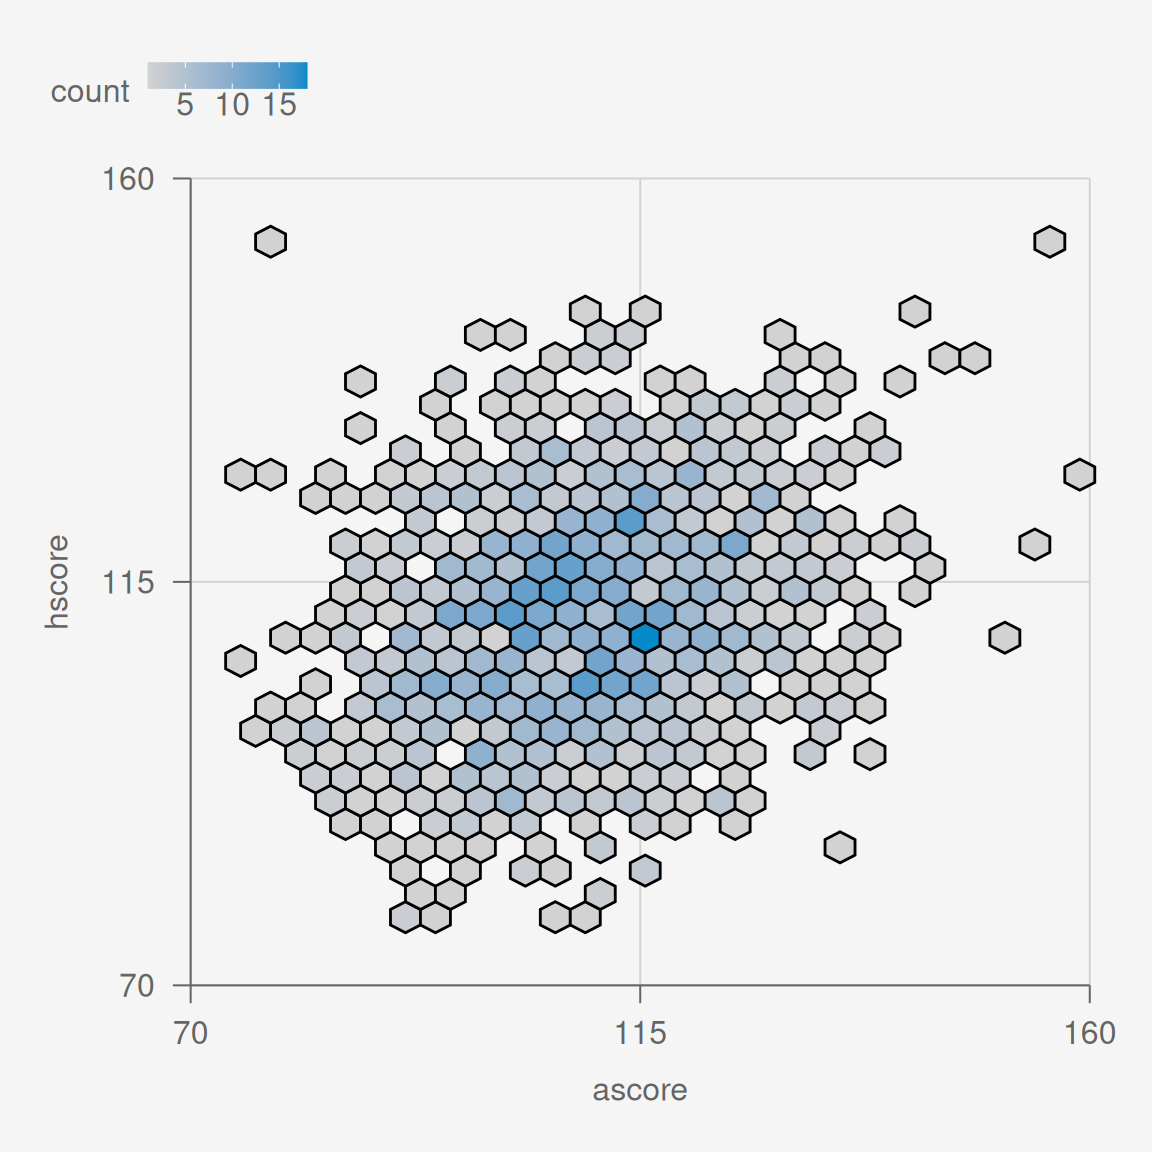
B.10 Hex bins geom_hex
You might prefer to plot a heat map instead, using hexagonal bins. This partitions the plane into hexagons, counts the number of points in each hexagon, and colors the hexagons by the number of points. Note that color controls the color of the border of the hexagons, while fill controls the color of the interior.

[1] 57.35768
[1] 80
[1] 20
[1] 157.3577
Code
[1] 57.35768
[1] 80
[1] 20
[1] 157.3577