B.6 Grouping observations with group

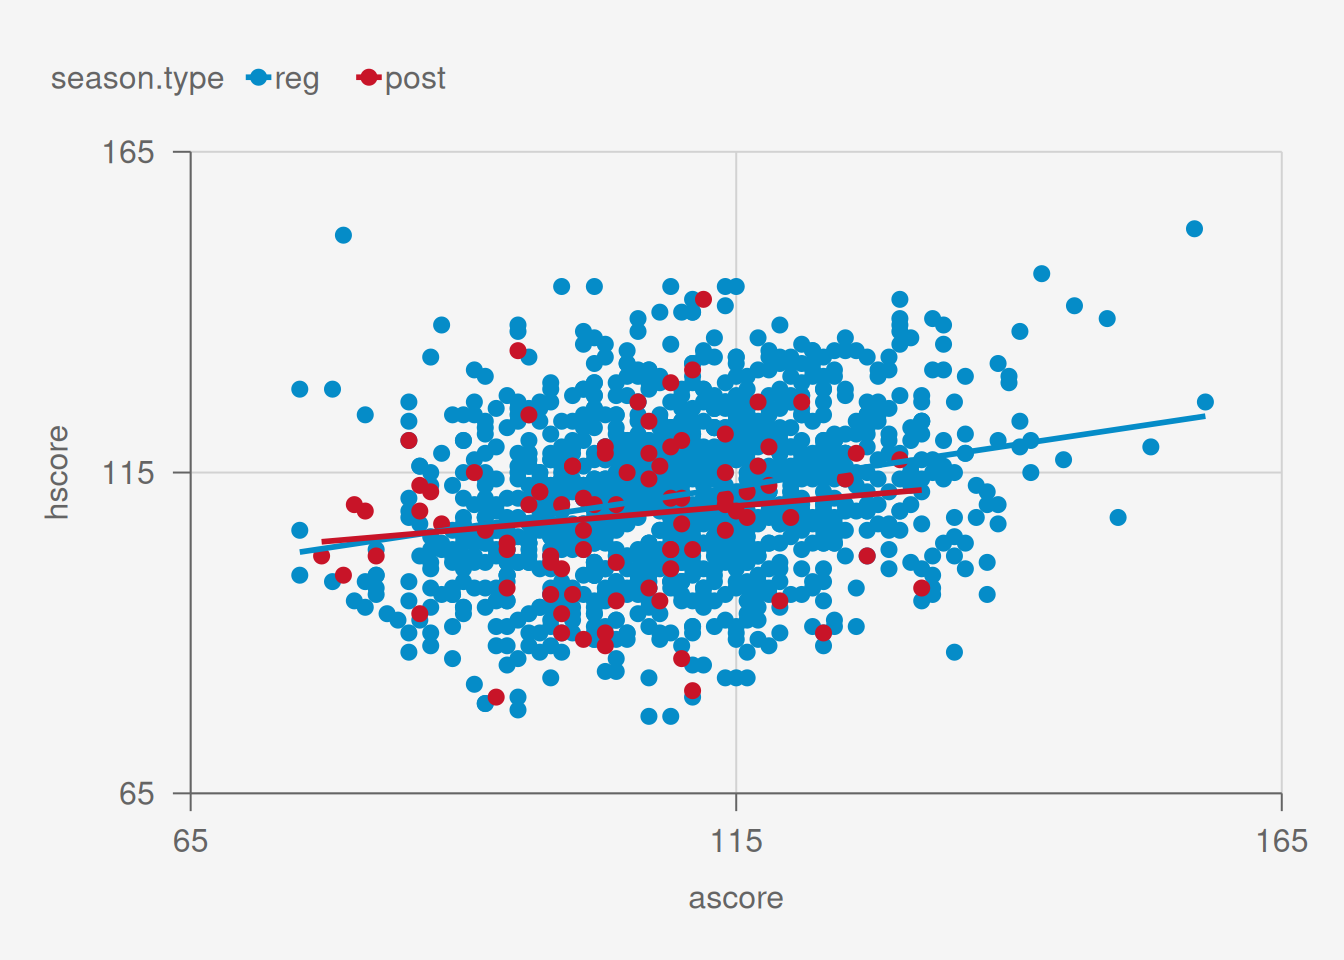
If you use color, then you get separate trendlines for each group.

Code
g = ggplot(d, aes(x = ascore, 
                  y = hscore, 
                  color = season.type))+
  geom_point()+
  geom_smooth(method = 'lm')

g %>% 
  pub(xlim = c(65, 165), 
      ylim = c(65, 165))

[1] 57.35768
[1] 80
[1] 20
[1] 157.3577

If group isn’t specified, ggplot assumes it should group by color. If we want to group by something other than what we are coloring by, we can specify it. Or we can say NA to say don’t group and get a single line.

Code
g = ggplot(d, aes(x = ascore, 
                  y = hscore, 
                  color = season.type, 
                  group = NA))+
  geom_point()+
  geom_smooth(method = 'lm')

g %>% 
  pub(xlim = c(65, 165), 
      ylim = c(65, 165))

[1] 57.35768
[1] 80
[1] 20
[1] 157.3577