4.7 Scoring vs stronger/weaker opponents
Let’s find the average points allowed for each team, and add a column to the data frame that says the average points allowed by the opp.
Code
        date team score opp opp.score season      gid   ha avg.pts.allowed
1 2020-12-22  GSW    99 BKN       125   2021 22000001 away        113.0325
2 2020-12-22  BKN   125 GSW        99   2021 22000001 home        108.8247
3 2020-12-22  LAC   116 LAL       109   2021 22000002 away        111.2208
4 2020-12-22  LAL   109 LAC       116   2021 22000002 home        108.1299
5 2020-12-23  MIL   121 BOS       122   2021 22000003 away        107.6039
6 2020-12-23  BOS   122 MIL       121   2021 22000003 home        113.1169
Code
tms = read.csv('data/nba.teams.csv')

tms = tms %>%
  arrange(conf, div) %>%
  mutate(conf = paste0(toupper(substr(conf, 1, 1)), substr(conf, 2, nchar(conf))),
         div  = paste0(toupper(substr(div , 1, 1)), substr( div, 2, nchar( div))),
         div  = factor(div, levels = unique(div)))
head(tms)

dg = dd %>%
  left_join(tms %>% select(-conf),
            by = 'team') %>%
  group_by(div) %>%
  mutate(group =
           team %>%
           as.factor() %>%
           as.numeric() %>%
           as.character())

head(dg)
team div conf
1 BKN Atlantic East
2 BOS Atlantic East
3 NYK Atlantic East
4 PHI Atlantic East
5 TOR Atlantic East
6 CHI Central East
# A tibble: 6 × 11
# Groups: div [3]
date team score opp opp.score season gid ha avg.pts.allowed
<date> <chr> <dbl> <chr> <dbl> <chr> <chr> <chr> <dbl>
1 2020-12-22 GSW 99 BKN 125 2021 22000001 away 113.
2 2020-12-22 BKN 125 GSW 99 2021 22000001 home 109.
3 2020-12-22 LAC 116 LAL 109 2021 22000002 away 111.
4 2020-12-22 LAL 109 LAC 116 2021 22000002 home 108.
5 2020-12-23 MIL 121 BOS 122 2021 22000003 away 108.
6 2020-12-23 BOS 122 MIL 121 2021 22000003 home 113.
# ℹ 2 more variables: div <fct>, group <chr>Code
title = "Points Scored vs Average Opp Points Allowed"

g = ggplot(dg, aes(x     = avg.pts.allowed,
                   y     = score,
                   group = group,
                   color = group))+
  geom_jitter(width  = 0.1,
              height = 0.1,
              alpha  = 0.1,
              size   = .75,
              show.legend = F) +
  geom_smooth(method = 'lm',
              alpha  = 0.1,
              se     = F,
              size   = 1,
              show.legend = F) +
  geom_abline(slope = 1,
              intercept = 0) +
  facet_wrap(~div,
             nrow = 2) +
  labs(title = title,
       x     = 'Avg Points Allowed by Opponent',
       y     = 'Points Scored in the Game')

g %>%
  pub(xlim  = c(105, 119),
      ylim  = c(80 , 150),
      facet = T)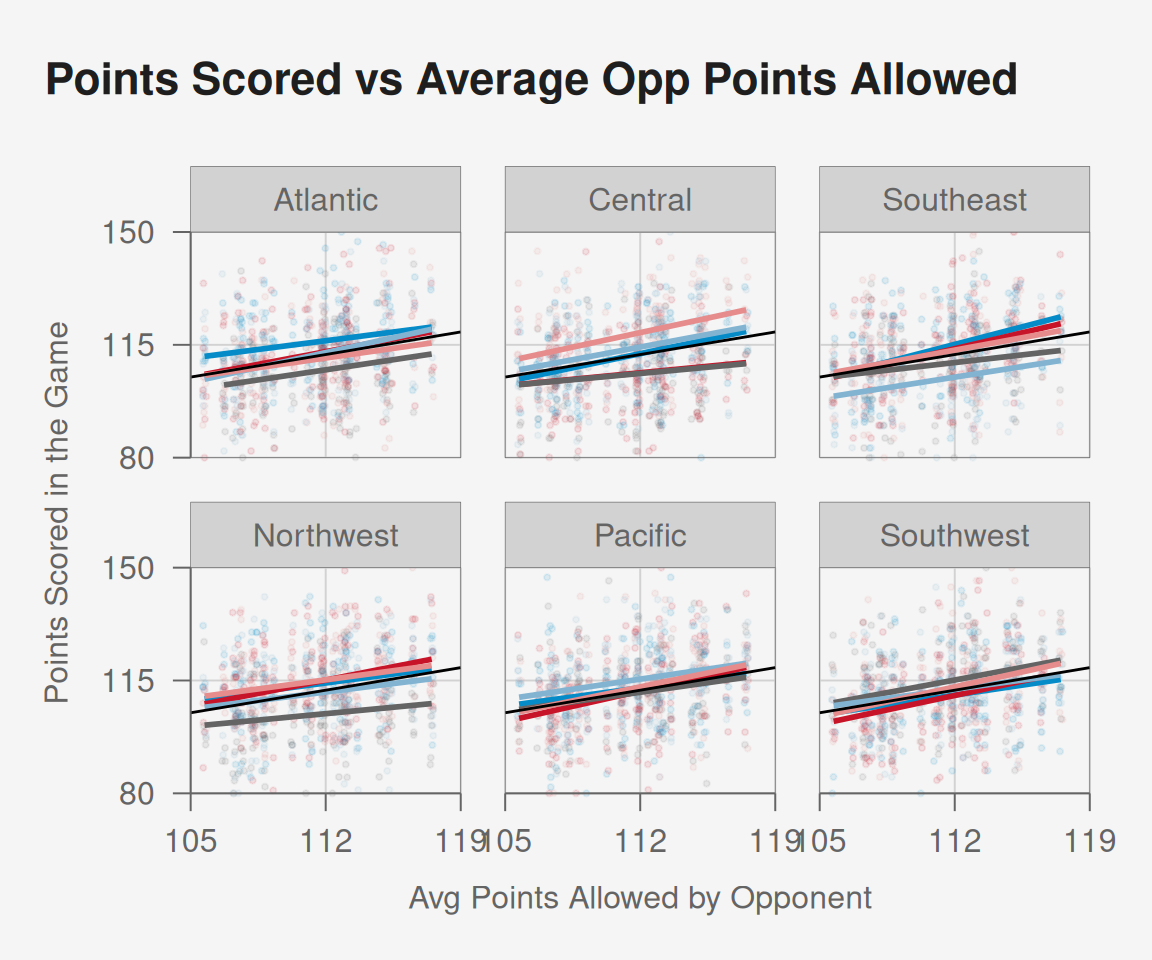
[1] 57.35768
[1] 80
[1] 20
[1] 157.3577