28.1 Dollar cost averaging example
Code
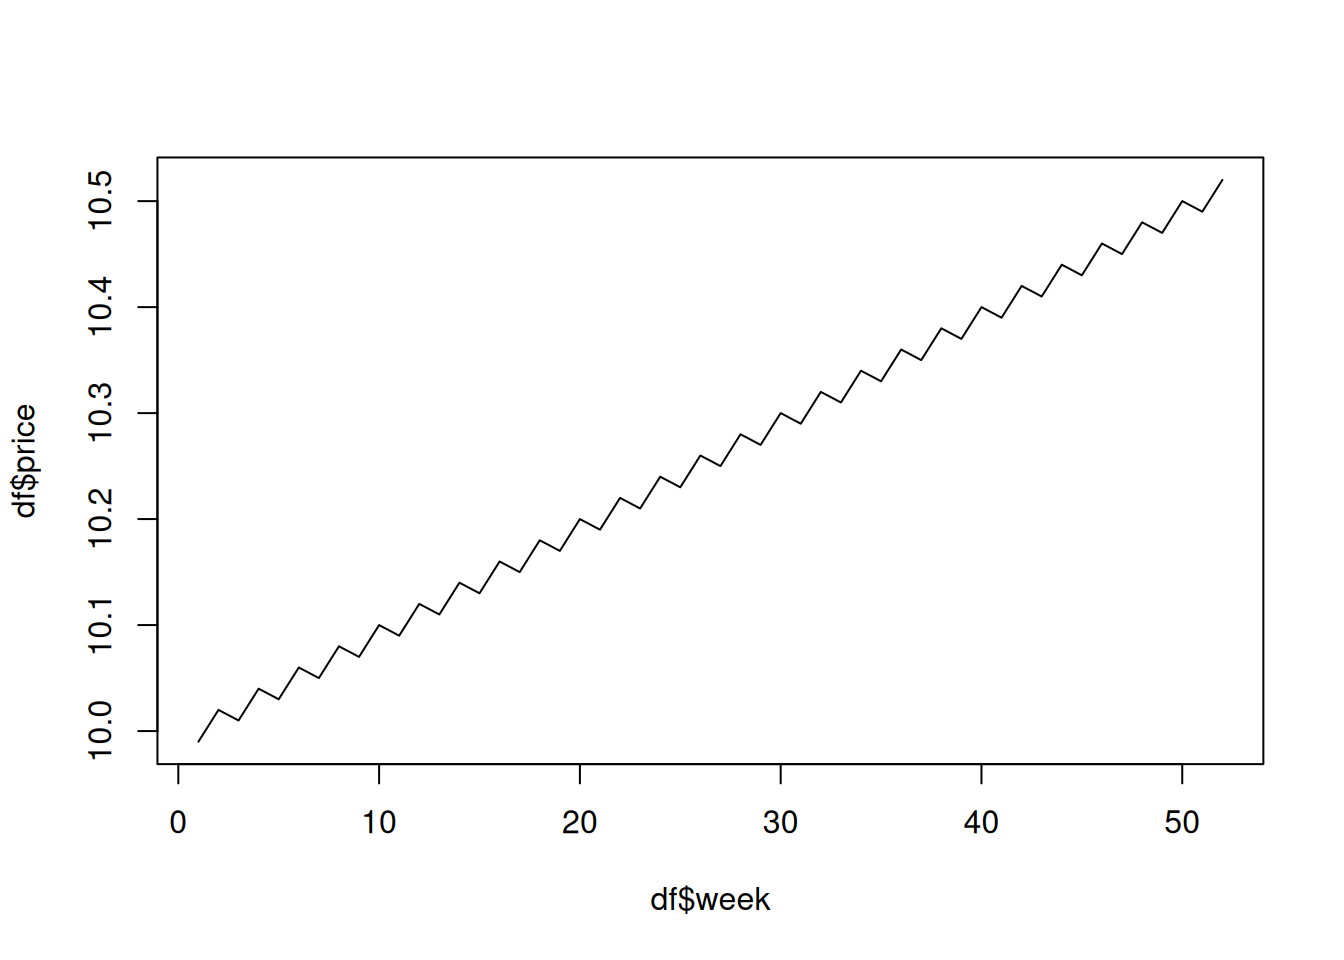
Suppose you have $5,200 to invest. If the S&P500 goes up more often than it goes down in a year, then should you buy up front at the start of the year, or dollar cost average?
Code
[1] 5475.876
[1] 5335.527
The linear with oscillation increase is too simple. Should use actual stock prices.
Functions from dplyr
filter,select,mutate,rename,summarize,arrange,group_by,*_join,pivot_longer,pivot_wider,ifelse,case_when- String multiple commands together with pipe operator
ggplot and related functions
- geom_’s:
geom_point,geom_jitter,geom_smooth,geom_line,geom_bar,geom_histogram,geom_tile,geom_segment facet_wrap,facet_grid
Note to self: see 425-625/notes/Reshaping and aggregating data for base R equivalents and comparisons.