B.2 Color, size, shape
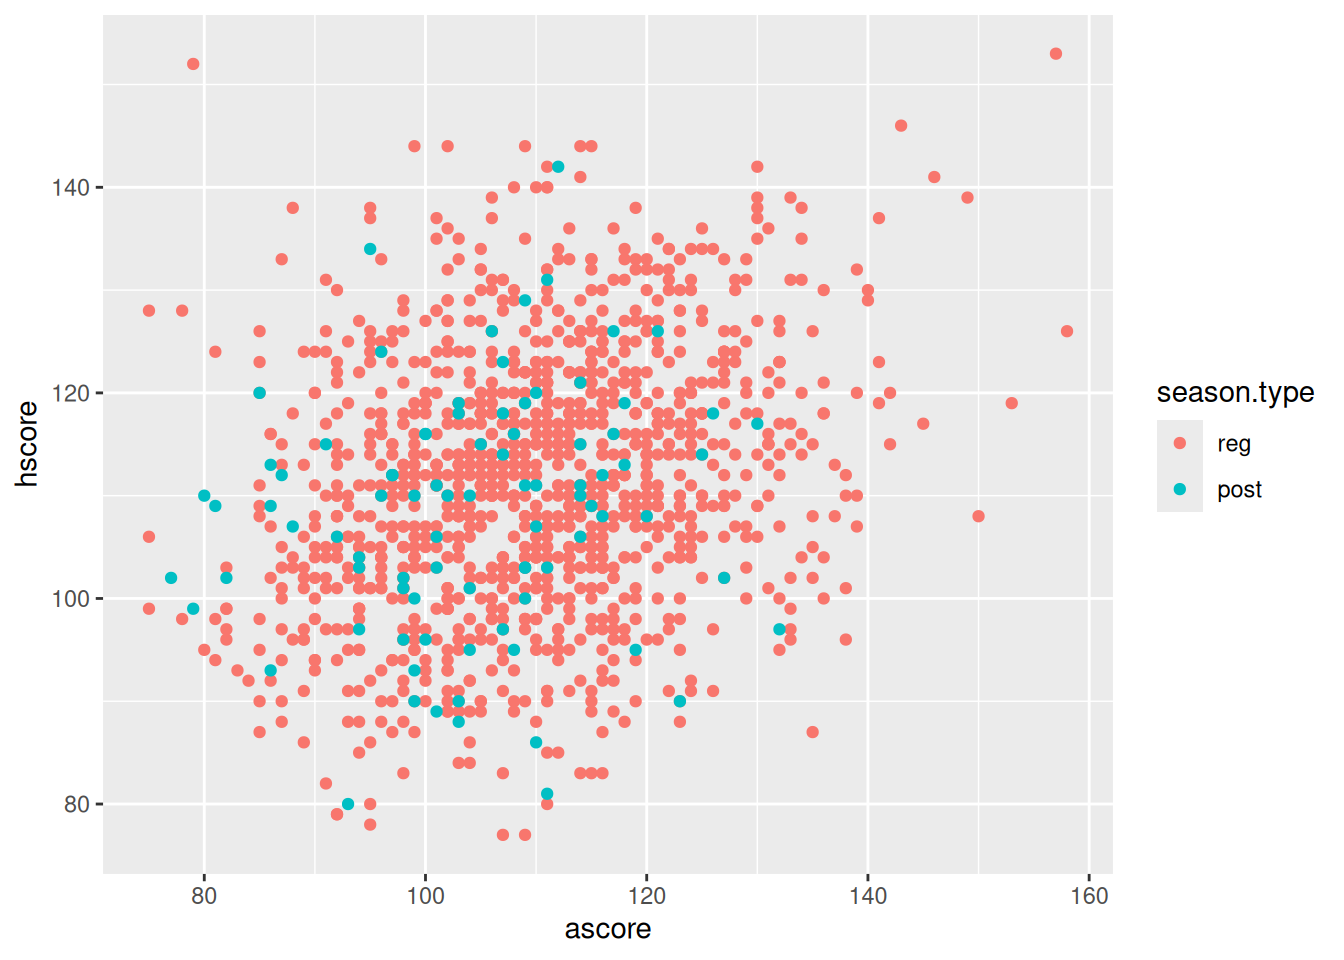
We can color by any variable in the data set by putting color = variable inside aes(). In this case, we’ll choose the categorical variable season.type.
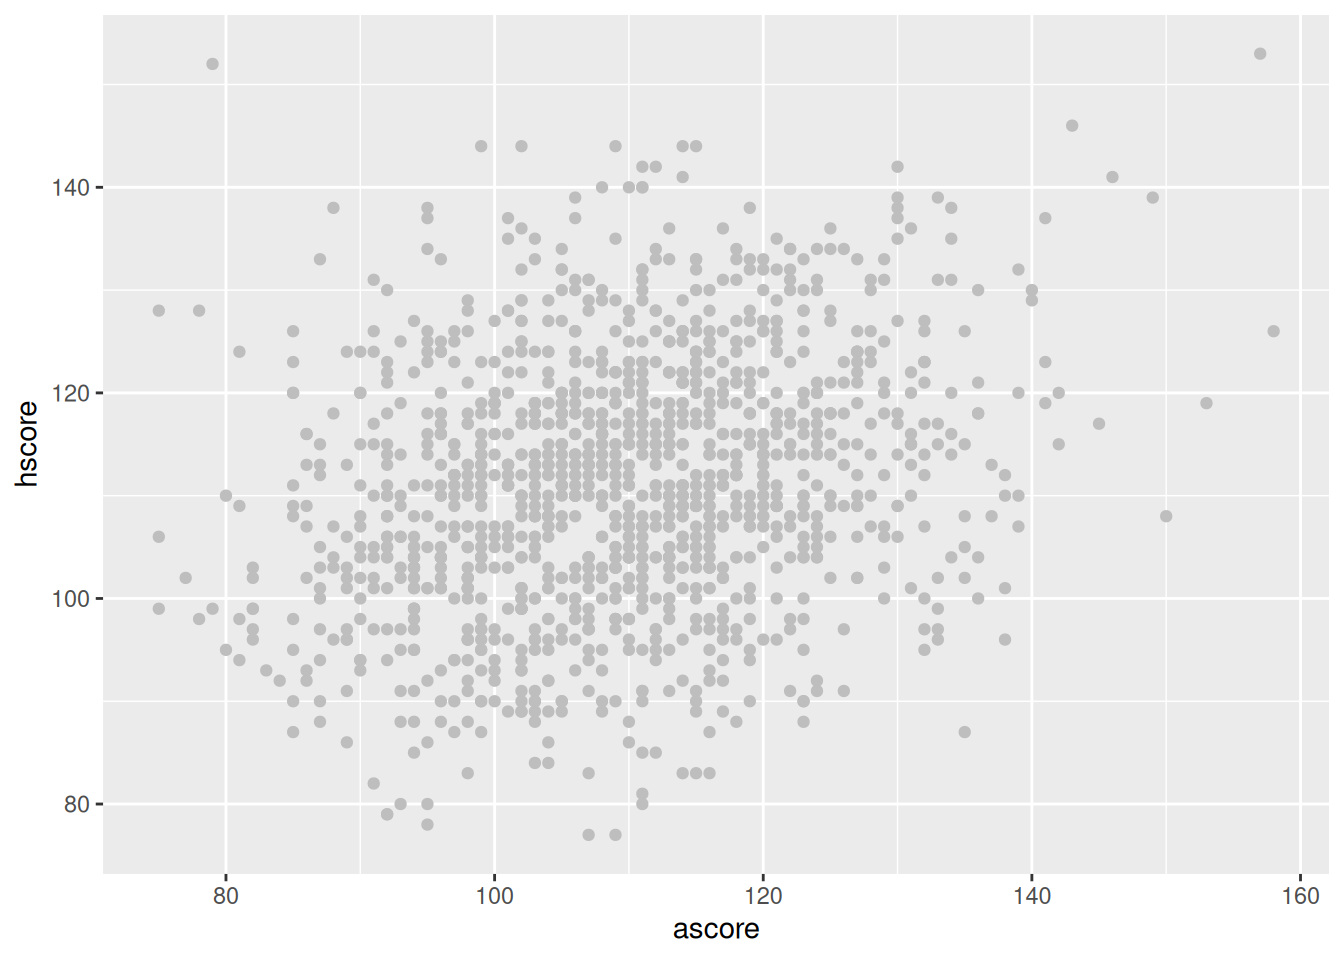
If we want to change the color of all points to the same color, we can specify that color inside geom_point() instead.
Likewise, we can size each point, or change the shape of each point, based on column in the data.
Code
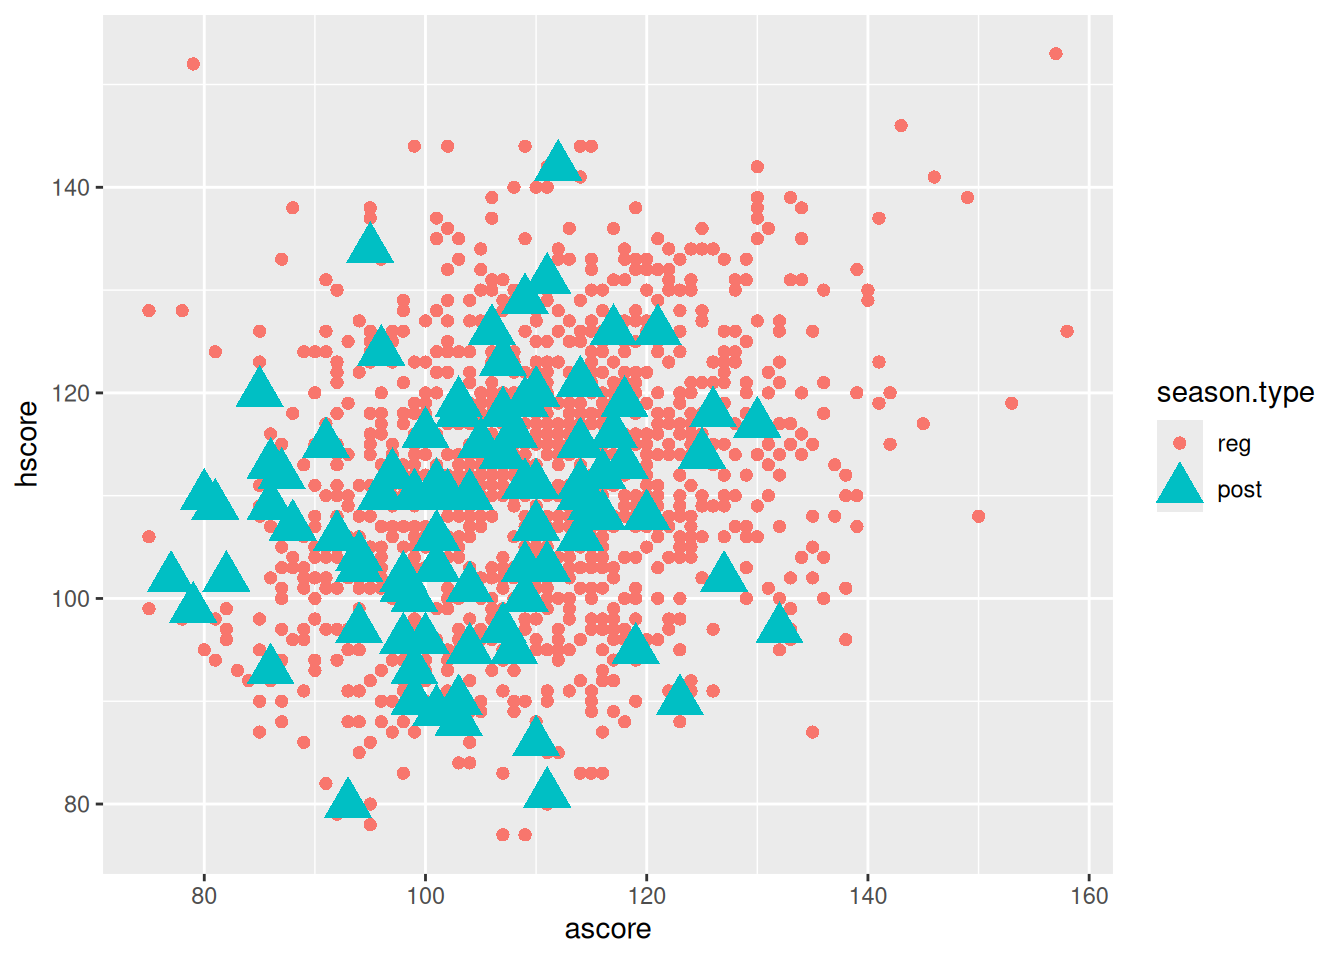
(You normally wouldn’t choose all three to be the same column, this is just for illustration.)