B.19 Maps
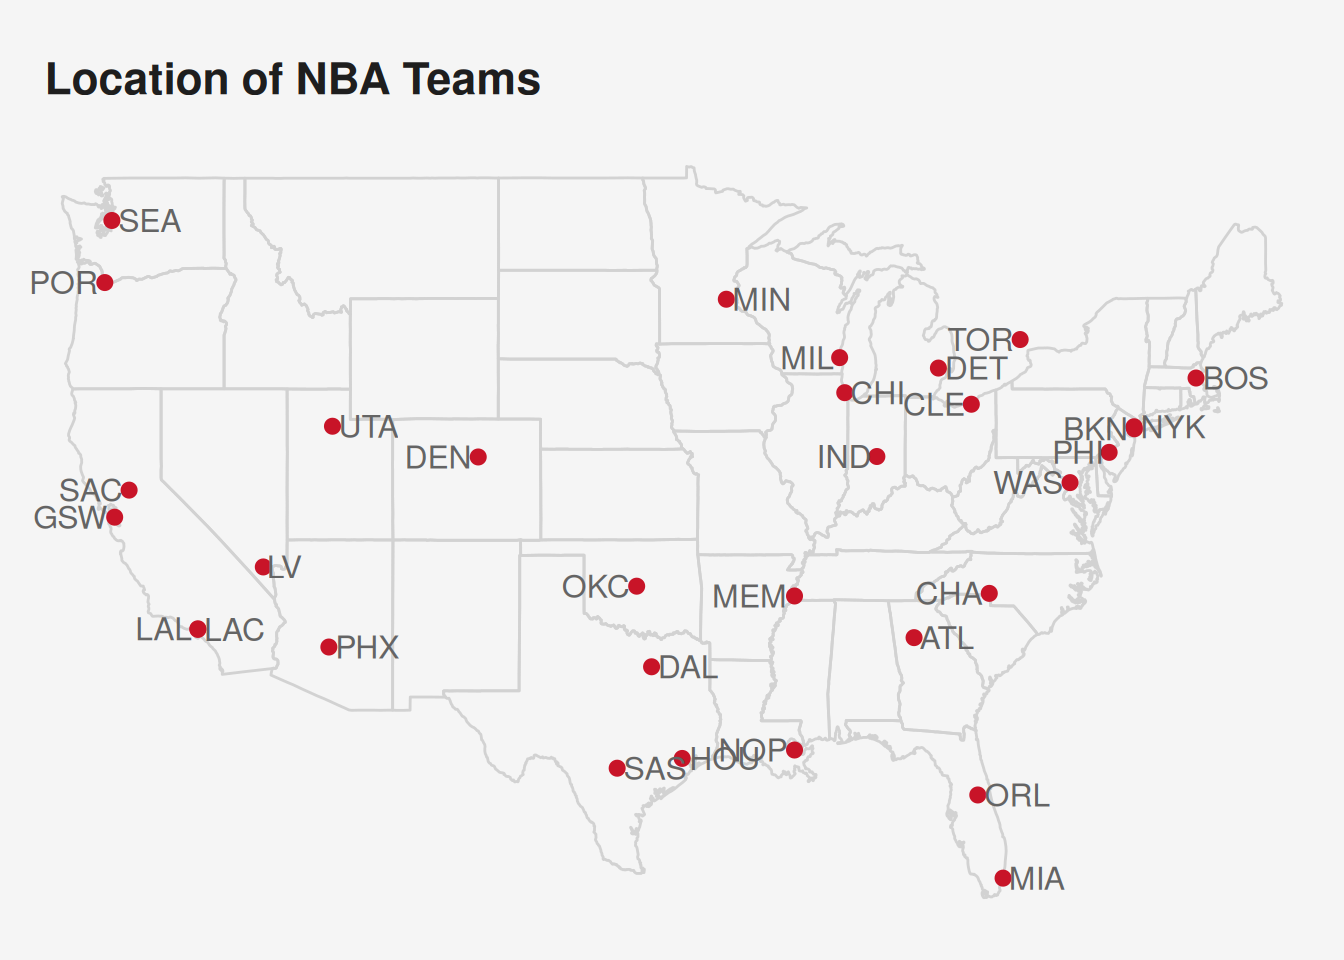
  team                   arena      lat      long
1  ATL           Philips Arena 33.75710 -84.39717
2  BKN         Barclays Center 40.68327 -73.97619
3  BOS               TD Garden 42.36635 -71.06193
4  CHA Time Warner Cable Arena 35.22506 -80.83933
5  CHI           United Center 41.88062 -87.67463
6  CLE     Quicken Loans Arena 41.49694 -81.68929
Code
dg = ll %>%
  select(team, lat, long)

title = "Location of NBA Teams"
g = ggplot(dg, aes(x = long,
                   y = lat,
                   label = team))+
  borders('state',
          colour = publightgray)+
  geom_point(color = pubred)+
  geom_text(hjust  = rep(c(-0.1, 1.1), 16))+
  labs(title = title)+
  coord_cartesian(expand = F,
                  clip   = 'off')+
  theme_pub(type = 'map')

g